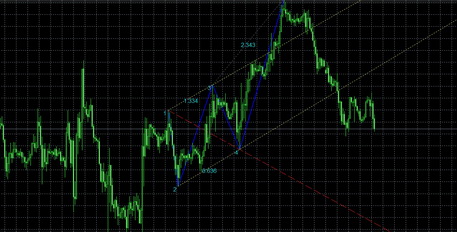
Fibo
The Fibonacci indicator is popular Forex trading tool chosen by many traders due to the convenient use. The name comes from the Italian physicist who studied numerical sequences.
The robot forms the Fibonacci levels on the chart so that a trader can pre-set entry points to the market, and even draw up an order until the market has reached the specified point. The indicator can be applied to any liquid and technical markets, and therefore, to Forex. Below we will describe the features and the principles of trading with it.
With the help of the leading Forex indicators, traders can predict the behavior of the trend in the future. At the same time, lagging indicators are only able to report the trend that has already occurred. Undoubtedly, the lagging indicators allow tracking trend events much faster than watching the news yourself. Nevertheless, it's not enough to form a high-grade trading strategy.
Fibonacci levels operate in an entirely different way, so that a trader can pre-set entry points to the market, and even issue an order until the market has reached the specified point.
How do Fibonacci indicator works?
Any time frames from one minute to one month are appropriate. In the mathematical sense, the sequence of the Fibonacci levels means a number sequence. In such a sequence, each number is obtained as a result of some operation on the two previous numbers, in this case, the summation. This mechanism creates an interaction system between each number taken from the sequence. Below we will consider the types of interaction between the figures:
- Dividing one of the numbers by a next one, the bigger one, you get the constant value of 0.618. This number is unchanged for all the numbers in the sequence;
- Dividing any of the Fibonacci numbers by another one, you get a constant value of 0.328;
- The ratio between each third numbers in the row is 0.236.
Fibonacci levels in use
Some traders criticize the Fibonacci indicators considering their profitability subjective. Indeed, these indicators are tools that operate on the well-established mathematical basis. If a trader has failed, then the problem lies in his skills only. Fibonacci indicators can also be used in entirely different ways, depending on the chosen trading strategy, which allows the tool to be used by traders with different skill level.
The rebound moments are the most important for the Fibonacci indicators. When the price begins to fall after moving up (and vice versa), it is called a rebound. At this point, a trader must turn on the Fibonacci indicator, and track the price movement graph. In this case, the horizontal lines can act as a support, or resistance for dynamics.
In the case, a trend has traveled to the original point, the rebound is considered as 100%. To measure the rollback level accurately, you need to analyze a trend. The trend structure is a sequence of maximum and minimum values, which looks like the minimum and maximum points on the graph. The trend moves and changes direction between them, forming a price. To form a crucial momentum, you need a rebound from the minimum (or the maximum) value, in the opposite direction. For this reason, some traders fail with lateral positions, because if the trend moves between levels, without a rebound, the Fibonacci indicators are useless.
Features of the Fibonacci indicators
When a maximum or minimum trend position is formed on the market, the different calculation should be made. The line always ends at the point of the finite extremum.
- When the trend moves upwards for a short time, the line is drawn starting from the last minimum value and ends at the last maximum;
- When the trend moves down for a short time, the line is drawn from the previous maximum value to the last minimum;
- Within the long-term trend movement, all the lines of the indicator must end at the same points.
Key Levels
- 38.2 - this level is appropriate for trading on long-term trends only;
- 50 is an important position that can be used for short-term solutions, as well as to form the support and resistance levels;
- 61.8 - the most useful level to make purchases or sales in the Forex market. At this point, the long-term rebounds are formed. It must be noted that the 61.8 point is a "golden section," and this position is considered the most profitable among the Fibonacci numbers;
- 78.6 - The entry points are never placed on this level. It serves to install and fix the stop-loss. Using Fibonacci levels, you will protect yourself from profit losses by setting the stop at this point;
- 100 - this position marks the absolute reversal of the trend. Stop-loss is also set at this point. Unlike the 78.6 point, these stops are less reliable, because, moving towards this level, the probability of a price turn increases. This stop is most suitable for experienced traders who can rely on the chosen strategy, taking into account the relation between the possible profit and the risk.
Conclusion
The Fibonacci indicators are a useful tool that is suitable for any markets, at any time intervals. There are many technical indicators built by the Fibonacci levels, but an experience is required to get the maximum benefit from them. Beginners should get used to such tools before starting to trade. A trader has to practice to trade successfully.

 English
 русский


