Camarilla Levels
Monday, 28 August 2017 22:23
There are many types of support and resistance levels. However, it’s almost impossible to find a type suitable for any timeframe. The Camarilla levels are ideal for short time frames.
This method is based on the theory that the price of an asset reaching a minimum or maximum value tends to an average value. Average prices are also called the pivot levels.
The Camarilla levels are calculated based on the minimum and maximum prices of the previous day, as well as the opening and closing prices.
Features of the System

The Camarilla levels consist of ten lines, which depend on the closing value of the previous day. Five lines are drawn above this mark, and five lines are drawn below. The upper lines are marked by the letter H and numbers from 1 to 5. The bottom lines are also numbered, and marked by the letter L.
Two straight lines, located closest to the center, are usually not used for opening the deals.
All the lines are calculated using the formulas below:

- p is the closing price;
- h is the highest price;
- l is the lowest price.
Camarilla Levels in Trading
The success of trading depends entirely on the correctness of the construction, and in this case, it’s more convenient to use the Camarilla indicator, which calculates the necessary lines automatically.
H3 and L3 form a price channel, where the probability of a trend reversal is very high.
- If the price reaches H3 or L3 and turns, the instrument gives a signal about the right moment for opening a deal for purchase or sale. In this case, the Take Profit must be set at the different level 3, and the Stop Loss shall be fixed at the fifth level on the same side where the position was open.
- If the asset value breaks through the levels of H4 or L4, this indicates a strong trend. In this case, the indicator will also signal the opening of the transaction in the direction of the trend movement. The Take Profit is set on the fifth line, and the Stop Loss - on the third line.
Suppose the value of the asset approaches the H3 line. In this case, a Buy Stop order is placed on this mark. The Take Profit is set on the H5 mark. If you trade on breakdowns, then the Buy Stop is placed on H3. This method of trading will suit both beginners and experienced traders, providing a good profit.
Features of the Camarilla Indicator
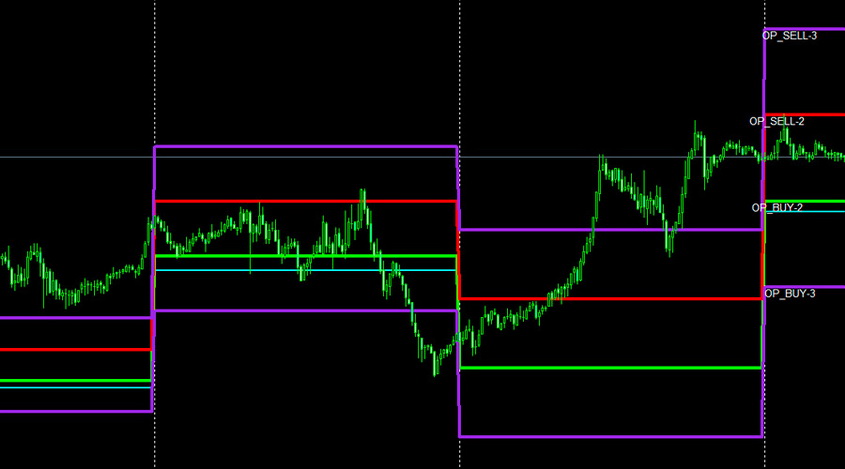
In the MetaTrader4 platform, this tool looks like this:

Camarilla determined the closing price automatically and calculated all the necessary levels. It also built the additional support and resistance lines, which facilitate the analysis of the market at the moment. When using such an indicator, the trade is carried out according to the algorithm described above.
It should be noted that, in addition to the classical version of the indicator, it’s also possible to build the lines dynamically. In this case, they are displayed in the form of curves, and a straight line is drawn along the center, which marks the possible reversal of the trend.

Despite the difference in construction, these two types of indicators are used in trade in the same way. All the levels are calculated using the formulas given above. Nevertheless, different traders prefer each type of indicator, depending on the usability.
This tool shows the best results on the M15 timeframe. It’s worth noting that the use of short time frames causes a lot of false signals. When analyzing the short time periods, it’s difficult to obtain the objective data, and many scalpers prefer to analyze the longer time frames, trading on the short ones.
The Camarilla indicator gives the scalpers an advantage since the reliability of the signals for the fourth levels breakdown is 60%. If you prefer the small volumes of transactions, or if you’re a Forex beginner, then you can trade only based on the price interactions with H4 and L4 levels. Making the deals on rollbacks from the third level, the trader gets the opportunity to earn a bigger profit, due to the frequent fluctuations of the price in this interval. However, in this case, special attention should be paid to filtering the false signals.
Notes
It’s worth using the Camarilla tools in combination with another technical indicator, for example, Stochastic, or CCI, to provide the reliable filtering of false signals. It will help to reduce the risks significantly.
We also recommend testing this tool on a demo account before using it in the real trading.
Share
Related articles
- Previous article: Dinapoli Levels: Application in Trade
- Next article: How to choose a trading robot

 English
 русский


