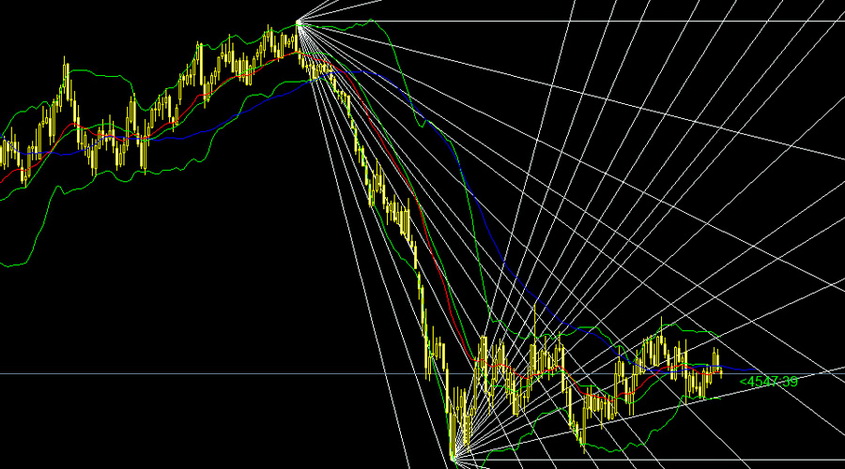
Gann Angles Indicator
Sunday, 27 August 2017 23:28
William Delbert Gann became famous throughout the world for his contribution to the development of Forex technical analysis. Gann was convinced that you don’t need to use a lot of complicated tools for a successful analysis. As a result of many studies, he concluded that the value of an asset is related to time.
Then the Gann Fan indicator was created. It helps to assess the market situation at the moment with accuracy. This tool consists of rays drawn from a single point, with different angles of inclination. Visually, its graph looks like a fan, which explains its name.
The creator of such a fan noted that the indicator doesn’t always give reliable signals, but it can predict the trend reversals with high probability.
Features of Gann Angles
As already mentioned above, this tool is based on the theory of the relationship between time and price. For a particular time, the price changes by a certain number of pips. When the difference in price per unit of time is determined, the first angle is constructed. It’s equal to 45 degrees.

This ray is called 1x1. Mr. Gann considered it the most important one. If the price level rises above this mark, the trend is upward. If it’s below - there will be a downward trend. This ray is a resistance level for the bullish market trend, and its breakdown indicates a high probability of a reversal.
When constructing the remaining angles, some calculations are required. It’s necessary to find a point with such coordinates, in which the price will be twice bigger (line 2x1). The angle of its inclination is 63.75 degrees. In total, there are nine rays in the fan:

- 8x1 - 7.5 degrees;
- 4х1 - 15 degrees;
- 3х1 - 18.75 degrees;
- 2х1 - 26.25 degrees;
- 1х1 - 45 degrees;
- 1х2 - 63.7 degrees;
- 1x3 - 71.25 degrees;
- 1х4 - 75 degrees;
- 1x8 - 82.5 degrees.
The tool developer considered each angle as a support and resistance level, depending on the type of trend on the market. For example, with an upward trend, the 1x1 ray serves as a support level, the breakthrough which means the high probability of a reversal. If the breakdown occurred, the price would drop to the level of 2x1, which will become a new support line. Therefore, if this level is also broken, the price will drop to the next ray.
Application of Gunn Angles
Typically, this tool is used in two versions.
- Single fan construction on the local extremum, serving as a point of reversal of the trend.
Despite the fact that the minimum fluctuation of the value of an asset is equal to one pip, a step equal to 10 pips is used in the construction, to maintain the proportion in the scaling.
Every time the price breaks through the ray, the trend turns.

- Application of two indicators. Two indicators allow you to receive more signals about a possible reversal. It’s worth monitoring the price movement towards the Gann rays, to be able to react in time to the trend turn.

This tool, especially in combination with other indicators, makes it more likely to open the profitable trades. However, working with such a tool, it should be taken into account that its effectiveness directly depends on the correct choice of the price range.
Dynamic Fan
If you understand the mechanism of this tool, you can begin to build an active Gann Fan. Its feature is the construction on two extremums.
In general, the principle of construction is the same as the one described above, but the central 1x1 line connects the points of maximum and minimum prices for a particular time interval. The second point can also serve as the center of the second fan.
Gann angles serve as the basis for many indicators and can be used within various trading systems.
Among the other tools, it’s worth considering the Gann Signal Systems indicator, which appeared relatively recently, but already won the trust of many traders. The algorithms of the tool operate by several Gann indicators. After adding the Gann Signal Systems to the chart, the tool automatically notifies the user of the appropriate points for opening the positions. Red arrows denote a profitable opportunity to sell, the green ones - for purchase.
It’s worth noting that this tool also may give false signals. For such a reason, it’s better to use it in combination with the additional instruments, checking the signals for reliability.
Share
Related articles
- Previous article: The Analysis of Trend
- Next article: Angle of a Trend

 English
 русский


