How to Build Andrews’ Pitchfork
Friday, 18 August 2017 15:10
Andrews’ Pitchfork is a straightforward and convenient tool for technical analysis of the Forex market. It’s a part of a trading strategy developed by Alan Andrews, a well-known trader who spent his entire life for trading. Andrews earned his first million in the 20s of the XX century, predicted the market crisis of 1929, and revealed the secrets of his strategy to all the traders in the 60s.
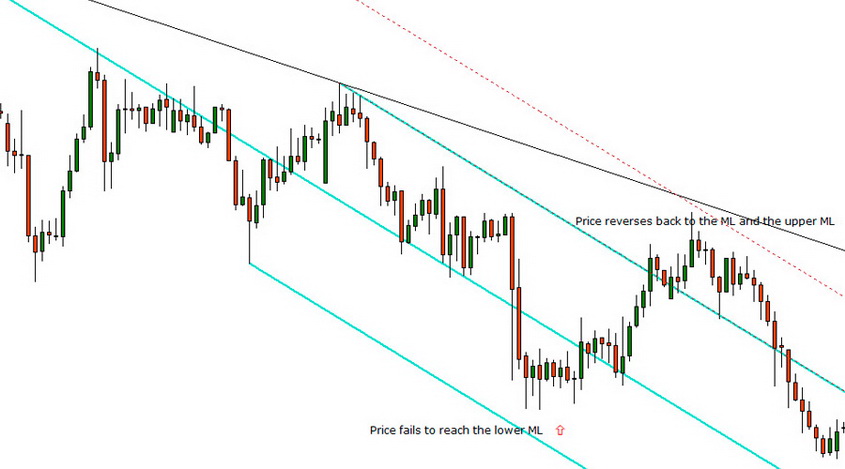
The strategy is based on the construction of a price channel. It’s divided into two parts. This "pitchfork" serves as levels of resistance and support. In this case, a trader searches for the moments when the price rebounds from the lines, and either continues to move within the channel or breaks through the boundaries of the channel.
Building the Andrews’ Pitchfork
To construct the Andrews’ Pitchfork properly, you need to follow these steps:
- Find a sharp reversal point on the price chart. We will specify it as A;
- Find the next turning point (B), and connect it with the previous one;
- The next turning point (C) is connected to B point;
- The segment between points B and C is divided into two equal parts;
- Draw a line through the A point and the middle of the BC section;
- Draw two lines from the points B and C, parallel to the previous one.

Trading Strategy
Now you have identified the key points of the trend reversal. Next, we will consider working with these lines.
- If the price of the asset rebounds from the borders frequently, this indicates a strong trend;
- The price movement is often directed to the central line. Therefore, after the price rebound from the upper and lower boundaries, you can set the take profit point on the central line;
- Entrance to the market can be located on the central line. More often, if the price crosses it, it will go to the border of the channel formed, rebound from it, and then return;
- If the channel is broken, a trend change is possible. In this case, the "pitchfork" must be redrawn, with a different distance between the lines and new inclination angle;
- Daily timeframes provide the most accurate construction; it helps to avoid most false signals.
Trading with Andrew's strategy is no different from the other channel methods. Depending on how high are the boundaries of the channel, a trader considers the significance of the breakdown. The central line helps to understand when the trend slows down, and the probability of the reversal.
The best time to open orders is the price turn on the central line, in the trend direction. If the price has broken through this line in the opposite direction, it would be better to exit the market or close the position partially, fixing the profit.
Features of the Strategy
It’s worth noting that the accuracy of such a method directly depends on the chosen timeframe. The longer is the time interval, the less false signals you get.
The author of such an instrument made a more accurate analysis of the graph readings, counting the waves, and estimating the probabilities with the mathematical calculations. You can avoid the false signals with the help of additional tools such as MACD CCI or RSI.
It’s also not necessary to carry out all the constructions manually. There are many indicators developed by the Andrews’ Pitchfork. When using the built-in algorithms, these programs analyze the asset price chart, identify the critical points of the trend, and build the resistance lines.
Share
Related articles
- Previous article: How Inflation and Deflation Affect the Currency Quotes
- Next article: How to Verify the Accuracy of Quotes in Forex

 English
 русский


