Long Shadows of the Japanese Candlesticks
Saturday, 19 August 2017 02:26
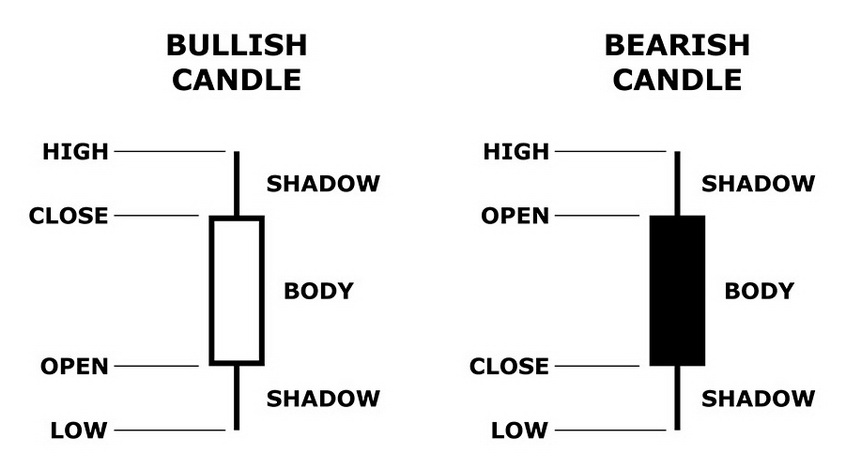
Each Japanese candle has a body and shadows. Many traders, analyzing the chart, look only at the bodies of the candles. However, shadows give a trader a lot of relevant information. The upper shadow indicates the highest value of the price for a particular time, and the lower one shows the lowest value. Trading on the candlestick charts, it’s important to understand what do candle size, shape and position mean.
Shadows of the Japanese Candles

Short shadows mean small price fluctuations between the opening and closing prices. If the candle has long shadows, this indicates an active struggle among the traders.
Consider the appearance of a long shadow with the following example:
- First, a long black candle is displayed, this indicates the domination of the bears;
- Bulls open a large number of purchase orders, while the deals for sale are closing;
- The market price increases and the shadows appear on bars;
- There is a short body, with a long shadow left from the first candle.
Accordingly, white figures are described by the opposite situation on the market.
If there is an upward trend on the market, and bars with long top shadows appear on the chart, then the peak value of the price had already been achieved. Similarly, the appearance of the long bottom shadows within a downtrend indicates the lowest price of the asset. After that, the direction of the trend often begins to change.
The long shadows near the levels of resistance and support is a good signal for entering the market. If long shadows appear on the chart during the uptrend, bulls close all the trades or a part of them. At the same time, bears prepare to open the sale orders.
Spinning tops
There are also candles with short bodies and the same shadows on the top and the bottom. They are called spinning tops.

The color of the candle doesn’t matter. If the spinning tops appear on the chart, this indicates the uncertainty on the market. Bulls pushed the price above, but couldn’t keep the maximum value. Bears dragged the price down, but they didn’t maintain the minimum.
As a rule, such patterns signal a change of the trend. The spinning tops are not the strongest signs of the trend reversal, but you need to take them into account during the analysis.
Hammer and Hanging Man
Sometimes you can see candles with long bottom shadows, and shortened bodies. Bullish figures of such a type are called hammers; bearish ones are called hanging men.

The hammer appears after a long descending trend. If you see a hammer on the chart, it means that the price may turn around soon, and then form a growing trend.
On the contrary, the hanging man appears as a forerunner of the uptrend changing to the downtrend.
Long Shadows in Trading
Without considering all the nuances of the graphical candlestick analysis, we can draw a few simple tips.
- If the patterns with long top shadows appear during the uptrend - prepare to close the buy orders. Market participants don’t want to buy at this price anymore. Now the asset has entered the overbought area, and it makes sense to open the sell orders.
- If there are candles with long bottom shadows during the downtrend, the traders don’t want to sell at that price anymore. The asset became oversold; it’s worth closing the sale deals and open the buy orders.
Most often, long shadows appear near the stable levels of support and resistance. Such figures say that traders don’t control the market.
Summary
Correct candlestick analysis allows you to understand the market participants' mood better. If you learn the candlestick analysis, you will be able to comprehend the behavior of big traders and be guided by their actions, which will increase your profits.
It’s worth noting that there are a lot of the candlestick patterns. The beginners may find it difficult to find them on the chart. In this case, you can install the candlestick indicators, which will identify the key figures automatically, notifying you about it.
Share
Related articles
- Previous article: Features and Key Strategies of Day Trading
- Next article: The Long-Term Trading – Basic Principles

 English
 русский


