Monitoring the Long Time Frames with the Mcandle Indicator
Tuesday, 11 July 2017 00:21
WHen Trading in the Forex market, many strategies require the analysis of the longer time frames. Making such an analysis, a market participant can get much more objective data, so his trade brings more profit and less loss.
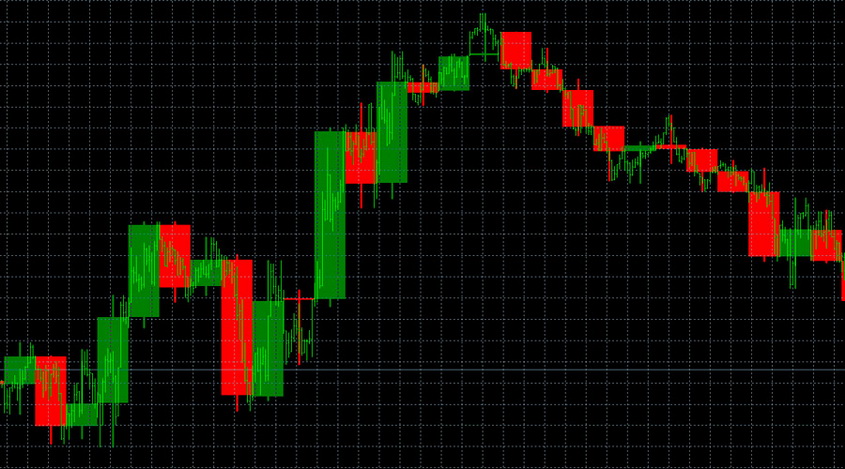
However, the MetaTrader4 platform doesn’t have any built-in monitoring tools for several time intervals. That’s why the Mcandle is so useful. This tool allows you to assess the market on a long timeframe, and then resume trading on a shorter one.
The principle of this indicator is quite simple. It calculates sums of candles at the shorter intervals, based on which it draws a single candle on a longer one.
Indicator Settings
- TFBar - the ability to display an additional time frame. Given that the index uses the data of minute time frames for calculations, it’s necessary to set the value of the time interval to 60 (for H1), to 240 (for H4) or 1440 (for D1).
- bcgr - this parameter can be set to true or false. If the value is true, the bodies of the candles of the older time frame will be colored. Within the "false" value, the indicator will show only the outlines.
- NumberOfBar - the number of bars that will be displayed on your chart.
- ColorUp - the color of the bullish candles.
- ColorDown - the color of the bearish candles.
Features of the Indicator
This tool is ideal for traders who are used to rely on the candlestick analysis. Often you can see prominent figures warning of a trend change on the older time frames, while on the short intervals only small fluctuations of price are displayed.

If you’re not sure about your forecasts, the extended time intervals can help you.
Mcandle is suitable for any currency pair, and is highly accurate, even used on daily charts.
Working with this tool, we recommend you to follow certain rules:
- Choose the time frames with accuracy. For example, if you’re trading on the M5 period, you will need an additional period of H1. For a more global assessment, use D1.
- Be sure to compare the signals of long periods with other tools of the technical analysis.
Mcandle can also be used to display the unusual time intervals. For example, you can get a two-hour bar, changing the value of TFBar to 120, or get a three-hour bar, with a value of 180.
Summary
Mcandle is suitable for traders of the different trading strategies. This tool will help you to get a more accurate assessment of the market events, and not to miss the right points for opening the deals.
It’s worth noting that such indications cannot be used as the only guide to the opening or closing the positions. It’s recommended to use such a tool as an addition to the effective trading strategy.
Share
Related articles
- Previous article: Engulfing Pattern - Application in Trade
- Next article: Features of Basement Indicators

 English
 русский


