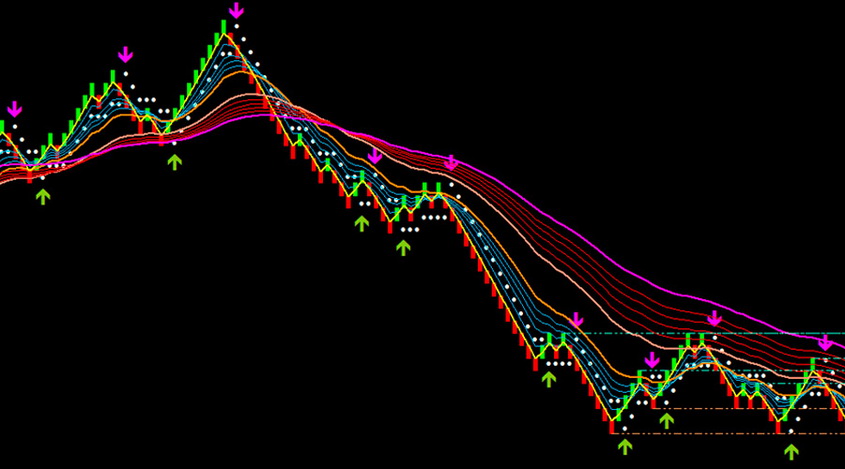
Renko: Advantages and Disadvantages
Wednesday, 26 July 2017 21:18
Renko is a type of chart used in Forex trading. As you know, the charts of price fluctuations can be represented in the form of lines, bars, or candles. Renko represents an entirely different approach. For the first time, this type of tool appeared in the arsenal of Japanese brokers and was named "Renga," in Japanese, "brick." This name reflects the structure of the graph, where each segment has an equal size of the other one.

This type of diagram can be represented both in the form of candles and in the form of bars. However, unlike the traditional bars and candles, Renko graphics display only the most significant price fluctuations, eliminating all the noise that don’t affect the trading decisions making. The mechanism of such a tool doesn’t take into account the trading volumes arranging a sequence of segments of the same size. Such an indication is much easier to perceive, and it becomes easier for a trader to analyze the state of the trend.
The principle of the Renko construction
The closing price of each new candle is compared to the maximum and minimum value of the previous one. The user selects the size of the "brick" in points. This parameter serves as a unit for measuring the value dynamics. If the difference in highs and lows is equal to one block, then it’s drawn on the graph. Otherwise, this difference is considered too small and ignored.
When the price of a new period grows relative to the previous one, the tool draws a white brick; if the price falls, then the black one. If the difference in cost is more than one brick, but less than two, then the graph will show a single particularly useful to.
This approach allows not only to filter a lot of minor fluctuations but also to determine the trend movements accurately.
Renko: Pros and Cons
When working with a Renko charts, it’s much easier for a trader to make the decisions about entering the market, or leaving it. On a typical daily chart of the USDEUR pair, with a minute period, more than 1,000 candles are drawn, while a similar Renko-graph would display these dynamics by 15-40 bricks. Accordingly, the user needs to analyze much fewer data. In general, we can distinguish the following main advantages of Renko:
- Accuracy of displaying trend as well as its emergence;
- Elimination of the market noise;
- Ability to use it along with other indicators and advisors;
- No data redrawing;
- A quite low percentage of false signals.
However, just like any other tool, these diagrams also have drawbacks.
- The bricks are drawn slowly. Unlike the traditional candles, Renko doesn’t take into account the time factor and makes the construction depending on the path passed by the price only. One brick can be drawn for a minute or a few hours. If there is a consolidation on the market, new bricks may not appear for a long time, ignoring the frequent small price fluctuations. In the zones where the moving averages converge, as well as at other key points of the market, the segments will show a multi-directional movement for a long time. It can be observed most clearly when the price reaches the level of resistance or support.
- The size of the Renko bricks plays a key role. With a small value of such a parameter, the graph begins to display the noise. If it’s quite big, the speed will drop.
- Bricks of the opposite direction are much less common than the unidirectional ones. This feature can be an advantage in trend trading, but the use of the additional indicators becomes complicated. Many advisors can display too leading values, and accordingly, give the false signals. Tools that use the transaction amount won’t work at all.
- The number of bricks that the price has moved by is known only after the previous candle closes. The reason is that the formation of Renko is based on closing prices only.
Application of Renko
Signals for purchase and sale are displayed as a brick of a new color. Suppose you opened a deal after the first black brick appeared. Then you should to leave the market on the white one.
Renko can be combined with any type of trading strategies directly facilitating and filtering out the incoming data. This feature will be especially useful for the beginners.
Considering the mechanism of Renko, it’s best to apply such a type of chart for intraday trading within minute time frames. If a trader wants to use the additional tools, he should select the tools carefully to avoid the false signals.
Share
Related articles
- Previous article: Rating - Top Expert Advisors
- Next article: Smoothing Moving Averages

 English
 русский


