The Best Technical Indicators on the Forex Market
Tuesday, 18 July 2017 04:41
The currency market implies not only a variety of trading techniques, but also the development of technical tools used by traders to analyze the price fluctuations and find the successful positions for deal making.
Among all the means of technical analysis, it’s impossible to single out one indicator, which would be characterized by the best work in any conditions. Moreover, each tool shows different efficiency being used with different trading strategies. Nevertheless, there are tools that have earned the trust of millions of traders, and have been used on the currency market for many years.
Types of Indicators
Moving Averages

These lines help the trader to find the direction of the trend. MA also displays the points where the direction of the trend has changed at. This line shows the average value of the asset for the selected period, given the opening or closing prices. Using two MAs with different periods (a fast one and a slow one), their intersection will suggest a good opportunity to open a deal. Also moving averages sometimes serve as dynamic levels of resistance and support. This simple tool serves as the basis for many other indicators.
Bollinger Bands

This indicator represents three moving averages, the central line is the main one, and the other two set the range of a price movement. The top and bottom lines serve as dynamic levels of resistance and support, and the width of the range between them speaks about the strength of the trend and the probability of its reversal.
Oscillators
This is a large group of tools, among which it’s worth considering the most popular ones.
- RSI is a curve that moves in a range of 0-100. If the indicator reaches the value of 70, this means the overbought state of the market. In this case, you should expect that traders will soon begin to sell more. Values less than 30 indicate the oversold zone, and the willingness of traders to start buying.
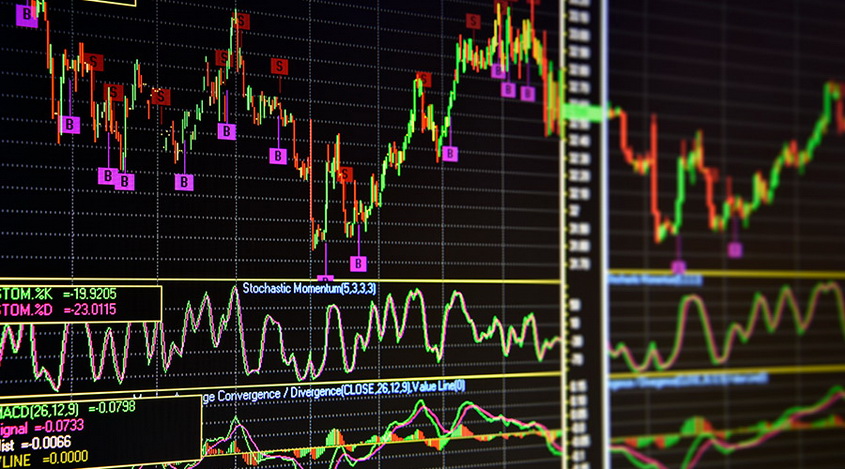
- Stochastic is a classic tool based on the probability theory. The range of its oscillations is also 0-100, and the overbought and oversold zones are marked with values of 20 and 80. Unlike the RSI, this oscillator has two curves, one of which is fast and the other one is slow. The signal for opening the positions is the intersection of lines in one of such zones.
- MACD is an oscillator based on three moving averages. However, visually it is a curve and a histogram, oscillating relative to the zero mark. This tool indicates the trend direction. It can also serve as a signal to open a sale or a purchase order. If the histogram crosses the curve from top to bottom, this indicates a suitable time for sale, the intersection from the bottom to top signals the possibility of buying.

There are a lot more technical tools. You can download new indicators and install them into your MetaTrader terminal. Nevertheless, many traders make successful trading using only the built-in arsenal of indicators.
To avoid losses and to ensure the effectiveness of the technical analysis tools, we suggest using them in real trading only after successful tests on a demo account.
Share
Related articles
- Previous article: Support and Resistance Lines
- Next article: Murrey Levels - Application of the Murrey Levels Indicator

 English
 русский


