22.03.2018
Futures trading for beginners

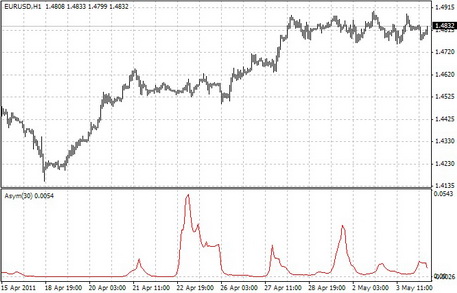
This indicator determines the asymmetry in the chart of the asset. Asymmetries in technical analysis are the ratio of the third central moment and the standard cubed deviation. The central moment is the tertiary average deviation of the selected members from the sampling frame.
Due to the fact that quotes are always fractional, the standard deviations are very small, so the asymmetry is usually calculated for values of the indicator RSI. In the end, the robot is considered to be trending.
The high values of asymmetry signal emergence of trends, while the low values - low-dynamic trend.
Share