22.03.2018
Futures trading for beginners

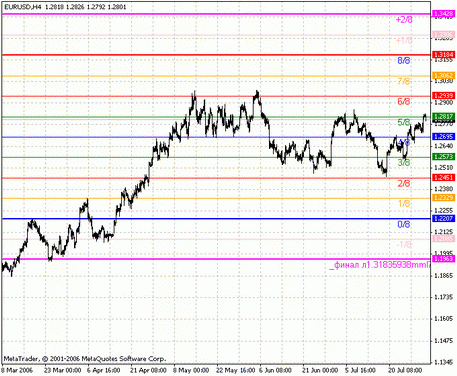
The indicator is based on the Murray’s theory. That’s why, the robot displays the Murray levels on the price chart. These lines are the levels of support and resistance. Moreover, the tool also draws the vertical lines which give the information about the duration of the current trend.
Share