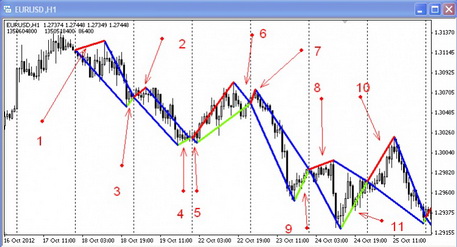
The indicator draws quadrangular patterns on the active chart. It works on hour timeframes. The corners of the figure are:
- Opening price for the current day;
- The maximum price per day;
- Closing price for the current day;
- The minimum price per day.
Indicator signals the following (using the example of the figure):
- If the narrow 3 is less than the base 1, then the trend will continue;
- If the narrow 4 is approximately equal to the base 2 - it’s a flat signal;
- If the narrow 6 more than the ground 5, it indicates a rapid trend change;
- If the narrow 9 is bigger than the base 7, there will also be a trend reversal;
- If the narrow 11 more than base 8 - it’s another sign of trend reversal.

