22.03.2018
Futures trading for beginners

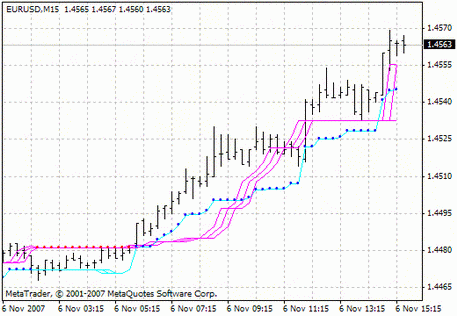
This indicator refers to the technical analysis trend instruments. It reflects significant levels of support and resistance. The indicator uses moving averages and Parabolic SAR. The VTS lines color and its direction show the current trend. Pink lines correspond to ascending trends, blue lines - descending trends. The points reflect support and resistance levels that can be used to place Take Profit and Stop Loss on the chart.
Share