AO-Osma
The Oscillator of Moving Average (OsMA) is a popular Forex indicator. Some analysts consider it a non-standard. The main task of of the OsMA is to identify the bull and bear divergences (between the asset movement and the oscillator.) Results of this indicator are similar to the MACD tool, which is used by some traders as an alternative. However, a more detailed study reveals the differences.
How the OsMA tool works
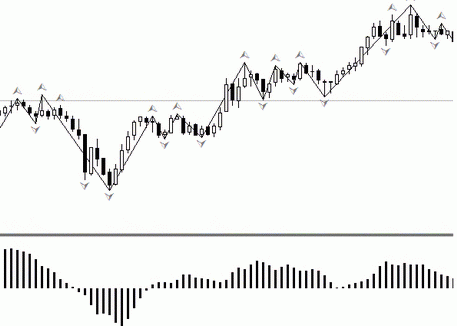
The OsMA indicates the difference between the middle line (called the signal line) and the MACD data. On the graph, the tool looks like columns. Their vector goes up or down in relation to the middle line. The column’s height grows if the indicator between the signal line and MACD goes in the positive direction (grows). On the basis of these data, the analysis of the forming trend is made.
The indicator’s settings
Setting up the OsMA indicator is quite simple and can be performed on any popular trading platform including MetaTrader 4 or 5.
While setting up the key parameters of this tool, please, use the following basic parameters:
- The slow EMA indicator is a moving average (exponential type) with a long period. The standard value is 26.
- The fast EMA indicator has the same parameter (like the slow EMA), but the initial value is smaller and equal to 12. To calculate MACD, you need to subtract the value of the fast EMA from the slow one.
- MACD OSMA is a universal moving average, which is a signal line. Its key task is to smooth out the generated histogram. With the standard settings, the period is small and equals 9.
- Price type - you can generate any required indicators for this value (raw data). Traders often set the closing bars’ cost, but the other average prices will also work.
Divergence and OsMA indicator
Most of the modern indicators have a tendency to identify divergence. This indicator has been considered one of the strongest trading signals in the market.
Divergence is a clear sign of the changes in the asset value. It's not a simple identification of the price peak on the graph, but also has to mark revaluation indicators on another instrument. Divergence arises when the price is still moving in one direction, but the power is lost. Many traders analyze this feature to determine appropriate moment to buy or sell an asset.
Divergence is seen when the price graph and the generated OsMA histograms are diverging. If a trader notices a bearish trend (considered one of the most favorable moments for selling an asset), the price of a currency pair or another asset will grow. The point for the input should be determined by the oscillator. In this case, the asset’s value will soon begin to drop and a trader should start selling at that moment.
If a bullish trend is formed on the graph, all the signals and entry points are similar to those described above, but they must be formed in the complete opposite way. If the price line shows the need for a sale, the indicator will inform about the optimal period to buy the asset.
Key trading parameters
One of the key features of trading with this indicator is connection to MACD instrument. It is determined by analyzing trading signals for these two indicators.
When the OsMA histogram begins to cross the middle zero line from the bottom to top, it is time to buy an asset. If the bars continue to grow, it only shows strengthening of the formed trend vector. MACD indicator is configured this way: the deal is recommended until the curve begins to change the vector, or even partially slows down. Thus, the OsMA shows the trend change probability, which is also probably a signal to close the deal.
The same situation occurs while selling the asset. In this case, the histogram should break through the central price line from above. Please, note that any signals may be false. Therefore, many traders additionally use other tools to determine the trend level by neutralizing false signals partially.
As a conclusion, it should be noted that the advantage of such an indicator is ability to display divergence in time and to show a market balance between the bearish and bullish trends. Many experienced traders recommend using MACD indicator as an addition. They consider choosing only one of them irrational. A similar analysis system will allow more accurate filtering of the inaccurate signals.

 English
 русский


