Divergence
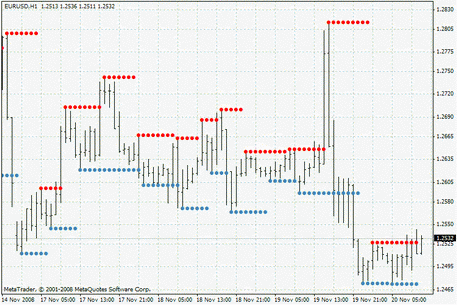
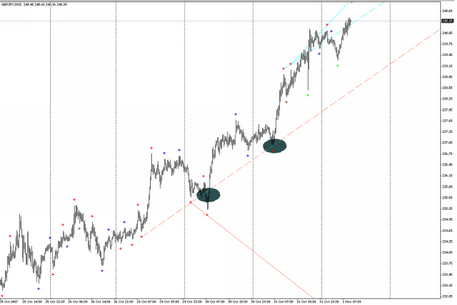
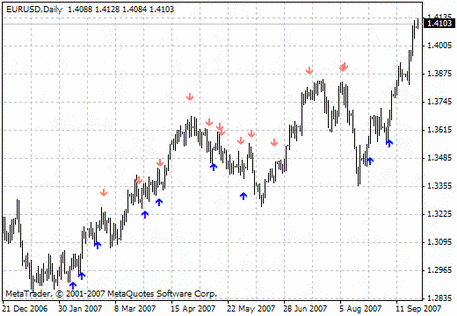
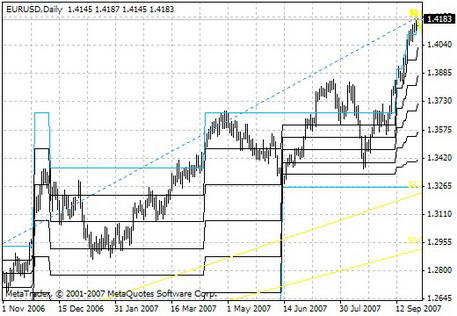
The indicator of divergence is a tool of technical analysis, which determines the level of the divergence of price ranges on the world exchange market, overbought and oversold levels and also provides accurate trading signals. The robot doesn’t only determine the presence of discrepancy but also gives the information about its type (bullish or bearish). This robot is used by traders of different levels of knowledge and trading experience.
Trading with the divergence indicator
Before you start trading with such technical analysis tool as divergence, you need to download one of the versions of it. It can be done free of charge on the MTDownloads website.
Trading with the help of the divergence tool is very simple because the line of divergence gives the most accurate signals that underlie trading forecasts. Divergence is the difference between the signals of the indicator and the price chart. There are several good indicators of divergence and signals of strong deviation between the price charts and the indicator values. It also shows the predomination of the ascending (bullish) or descending (bearish) divergence. Due to its last function, we can conclude in what direction to open the transaction:
- If the deviation is upward (bullish), then you need to buy assets;
- If the deviation is downward (bearish), then you need to sell the assets.
The most popular form of divergence is the classical divergence. It shows the difference in price and the signals of the indicator, giving the trader the information about the changes in trend and the turn in the price chart. This kind of divergence provides the most accurate signals on long or medium time frames. That's why it's better not to use it with short-term time periods. On time intervals less than an hour can be traced various false signals.
In addition to the classical or the correct divergence, there is also a hidden divergence. It gives good results only when the price moves by a particular trend. Of course, if you use two kinds of divergence, your trading results will be much better.
Not so popular, but also often used is an expanded divergence. It is used to confirm the trend of the market. The indicators of this type are better used on candlestick charts. If you learn to take into account the performance of all three types of price divergence, your predictions will be unmistakable.
The experienced trader can determine the price deviations manually - for them; it is enough just to look at the graph and to determine whether it exists on the given time interval. However, if you are a newcomer in trading, it is better to use the tool of divergence. For using it, you need to understand its basic parameters and set them up in a proper way. Only after this, you can start trading.
Parameters:
- Fast_EMA - 12;
- Slow_EMA - 26;
- Signal_SMA - 9;
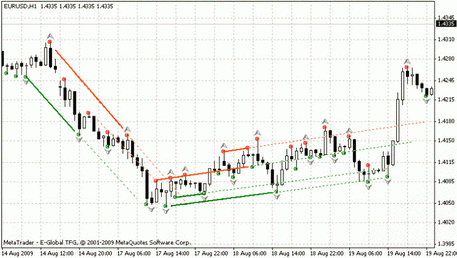
- Draw_Indicator_Trend_Lines - true;
- Draw_Price_Trend_Lines - true;
- Display_Alert - true.
This tool of technical analysis reveals its best qualities only when using with other indicators, or rather, oscillators such as RSI, MACD, Stochastic. In such situations, they are playing the role of filtering tools. This quality makes them such perfect additions to the price deviation indicator. Using two tools of technical analysis makes it possible to avoid false signals even in such a highly volatile market as Forex. Also, you will receive accurate signals as quickly as possible, without any delays.
The significant advantage of this robot is its message function, which indicates about the discrepancy. It is configured to your taskbar, or it is sent to your e-mail address. So you will always be aware of the most favorable situation in the market for opening deals.
However, it has the only minus. This robot doesn’t take into account the mood of the market, and it sometimes gives false signals before the release of big news.
Anyway, to choose the instrument of a divergence that suits you, you need to try some of them on the demo account first. Only after that, you can start trading with real money.
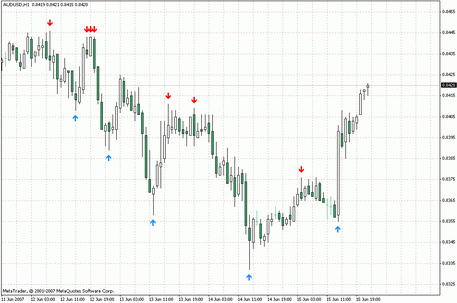
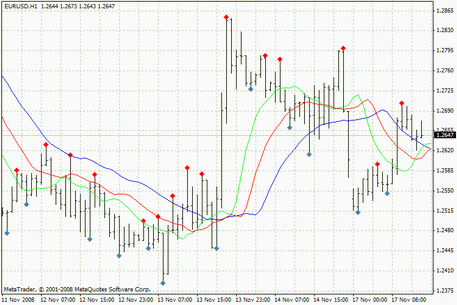
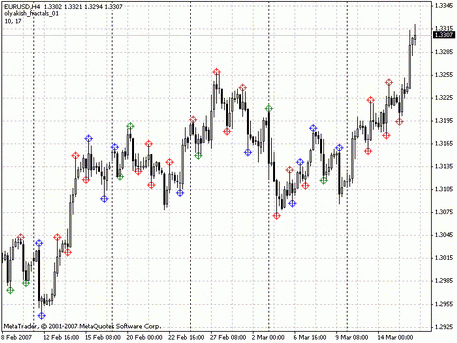
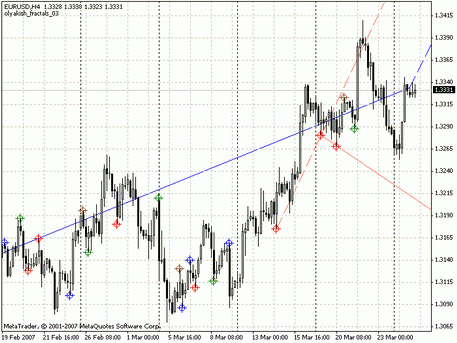
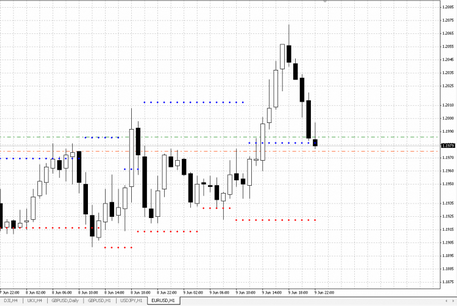
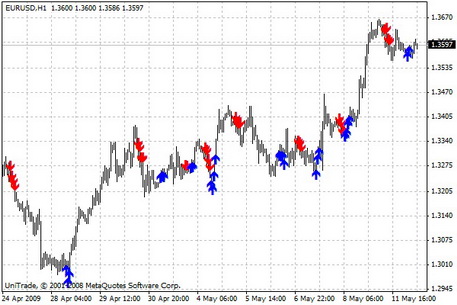
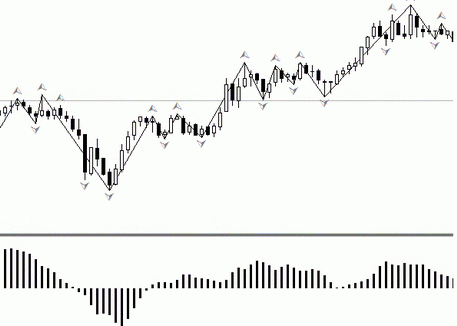
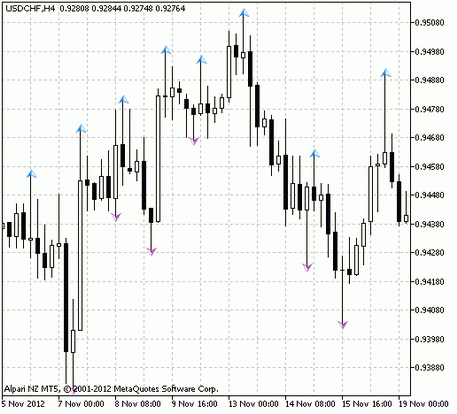
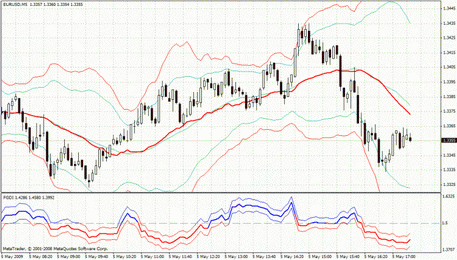
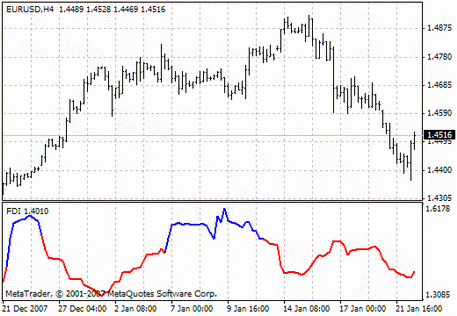
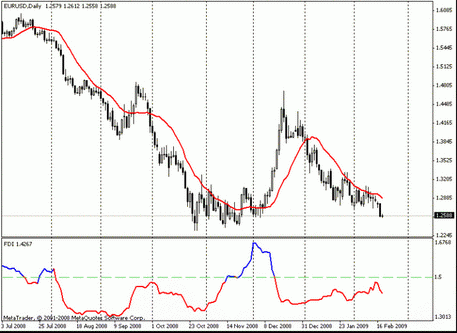
How does the divergence instrument look on the chart
You can find the signals of the indicator of divergence in a separate window on the trading platform under the graph of the price changes of the financial instrument. Depending on the tool chosen for determining the price deviations, it can be depicted in two ways: as a line or as a histogram.
Looking at all the advantages and disadvantages of this tool of technical analysis, we can conclude, that it is an excellent addition to any trading strategy. All versions of such an instrument you can find on the website MTDownloads and download them for free.

 English
 русский


