Gator Oscillator
The Gator Indicator was invented to maintain its innovative strategies of foreign exchange trading. It was created by one of the most famous Forex traders Bill Williams. Gator belongs to the group of oscillators and is used mainly for the flat market. In fact, the Gator oscillator is an advanced model of the Alligator robot, but it works like an ordinary oscillator. You can download the latest version of the Gator indicator on the MTDownloads website for free.
Like the other trading robots of Mr. Williams, this has a peculiar interpretation of the algorithm steps, but traders around the world prove its effectiveness.
To date, the Gator oscillator is one of the most popular technical analysis tools on the Forex market. Thanks to the non-standard view on the currency trading, the Bill Williams' strategy attracted the high attention from the very beginning. It should be noted that the trading methodology is quite particular, since the author didn't encourage a long-term market analysis, and considered it useless. However, despite this, the market participants soon recognized that the strategy does work, and the Bill Williams' indicators have become an indispensable tool for traders.
The Gator indicator is built in the MT4 trading terminal by default, but it's enough to download it for free on the MTDownloads website to work with the updated version of the robot. This trading tool is functioning the same as the another Bill Williams' indicator, the Alligator. Due to their similarity, the author recommended using these two technical tools together, as each of them sometimes delivers false signals.
Drawing the Gator oscillator
Gator oscillator was invented by B. Williams after the Alligator and represents an improved version of the latter (there was only a part of the name of the Alligator - 'Gator'). The Alligator indicator is also available for free download on the MTD website.
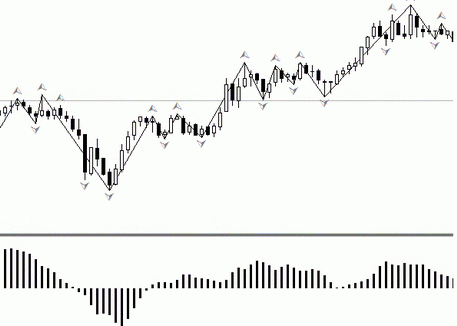
On the graph, the Gator is formed as a pair of histograms. The difference between the "alligator's teeth" and its "jaw" is drawn above the central axis. Accordingly, this involves a moving average of 8 periods with a shift of 5 bars, as well as a blue line with 13 periods and a shift of 8 bars.
At the bottom of the chart, the diagram displays the green line fluctuations in 5 periods with a shift of 3 candles - it calculates the distance between the "alligator's lips."

The parameters used in the description above are standard, and traders can vary the values, depending on their strategy. You can test a variety of numbers, experimenting with the different financial mechanisms.
How the Gator oscillator works
The Gator indicator is a static, technical tool, which means that it doesn't give signals, but only displays the current market position. That's why the Gator shouldn't be used alone but in combination with the Alligator oscillator.
The algorithm of this oscillator is set to catch the convergence or distance between the Alligator lines. Turning to the author's interpretation, this indicates a period of hunger or sleep of the "beast," and according to the technical analysis canons, that's a time when a trend starts, or a range oscillation occurs.
The author of the indicator argued that the trend has four phases of the life cycle, and the Gator oscillator helps to recognize them. In particular, we are talking about such periods as
- Sleep (lines intersect, the market is flat);
- Awakening (a trend is born);
- Eating (a clear trend range is formed);
- Satisfaction (the market is experiencing a high activity stage, after which there will be a transition to the flat).
This technical indicator is useful for traders because it reliably separates the flat state of the market from the state of ascent or descent - the most significant periods.
If you see that the indicator lines on the graph are at a great distance from each other, this means that the oscillator is at the maximum. The author said that at this point the alligator is sated.
The situation when the histogram range converges to the central axis says about the flat in the market. Bill Williams called this condition the sleep of the alligator.
The line movement from one position to another means that there are dynamic changes in the market. If for example, the bars were formed close to the centerline and began to diverge, then a trend is born.
As for color designations, the bar appears on the histogram in red when the current price level is lower than the previous one. The green bar says the opposite. That means, the green bars appear at the time of the trend intensification, the red bars show weakness.
Recommendations for the oscillator use
Even though the Gator belongs to the oscillator group, it works well in any market situation. It doesn't have its own signals but simply shows the price movements. It is what enables traders to track the phases of the trend.
The author of the Gator oscillator recommended to use it in medium and large time frames. It is caused by the fact that for short periods, it is better to track point data, and it is more efficient to study the general state of the market on the periods of M30 and more.

 English
 русский


