Zig Zag
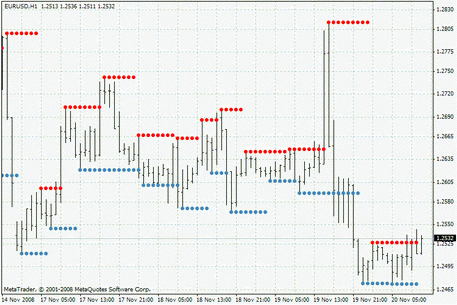
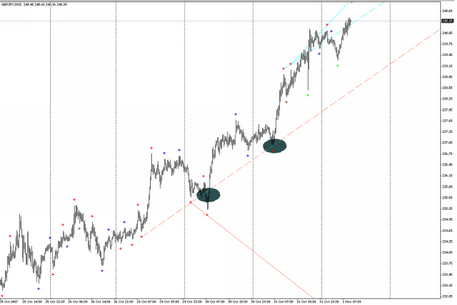
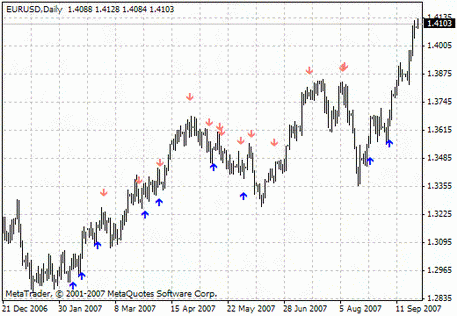
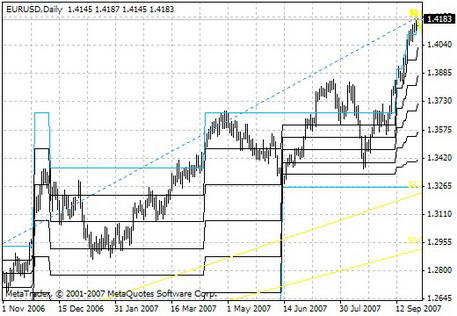
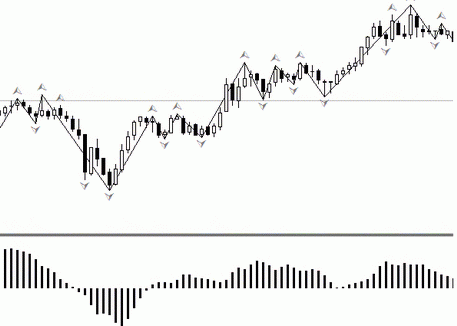
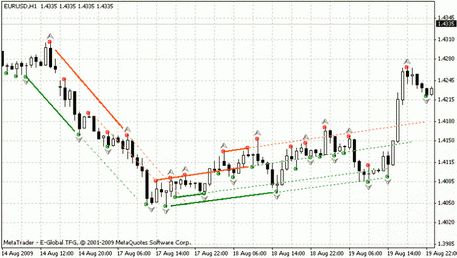
Zigzag is a tool of technical analysis displayed in the graph with the help of lines connecting the local minimums and maximums of the price. It allows you to see the price dynamics of the underlying asset. Download the latest version of the Zigzag indicator on the MTDownloads website for free.
Immediately after the emergence of the free international monetary system in 1978 - in fact, from the beginning of the trade free-floating exchange rates - all traders began to use technical analysis. Since that time much has changed. With the advent of computers, interbank trade shifted to a new level. The exchange market began to develop rapidly, and there are more assistants to use on the trading platform. They all work in different ways, and some of the robots are very popular.
For example, the Zigzag indicator shows the highs and lows of price charts by connecting them with a line. In the graph, it indicates the past market reversals and it is easy to calculate the probable future movements of the pair, volatility, price retreat, and trend reversals. It is very important to predict, because otherwise you can lose an impressive part of your deposit. It applies to those who do not consider stop losses and used to play a big-money game.
What is the Zigzag indicator?
This indicator greatly simplifies technical analysis because of ignoring the noise in the price channel. The market noise is a major factor in making mistakes.
The graph shows the maximum highs and lows. Along with lines, the graph shows the price channel. One significant disadvantage of an assistant is the change of the last line segment on the graph due to new data on market fluctuations. Therefore, this Zigzag indicator is to be used for technical analysis only for the past price changes.
There are two types of Zigzag indicators: standard, or primary, and restoration indicators. They are identical indicators and differ only by dotted lines within recovery indicators that show correlation. Basic Zigzag paves line on the chart based on the minimum price changes as a percentage.
Perfect companion for the robot
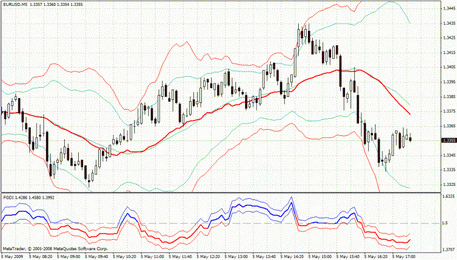
Technical analysis is a complex process that combines many tools and instruments. Therefore, one cannot rely on the only indicator. As for Zigzag, this indicator works better in the group, for example, with no less famous and popular Bollinger Bands. It is believed that the tool assists Zigzag and filters false signals and the market noise.
It makes a very important job, since wrong changes do not let traders determine the exact direction. Algorithm is very simple in spite of these aspects. In the settings, you need to enter the values, after which the indicator filters out fluctuations smaller than a specified value, considering them to be noise. Therefore, the indicator will not display the line until price crosses exhibited mark. Thus, a trader sets the range of a pair’s oscillation to be ignored by the program.
Zigzag performs well not only with the Bollinger Bands. The program is successfully used with the Elliot waves. For example, the five-wave structure on the EUR/USD chart of July 2012 is visible. It was formed during a month. Zigzag is successfully used for the price adjustment and for the primary measure of prices that occur in the trend direction.
Signals of the instruments
The configuration of the program is not complicated. It has only three changing values. The numbers entered in the program settings are a percentage of the maximum highs and lows.
- ExtDeviation - the minimum number of points between the highs and lows of the two adjacent candles (trading noise.)
- ExtDepth - the least number of bars where the indicator will not display the second maximums or minimums. Five candles are usually set. This value is considered optimal.
- ExtBackstep - the minimum number of bars between the highs and lows (for signal filtration.)
Advice on application
Zigzag is a great assistant in identification of the best moment to start trading. It shows high efficiency during establishment of the wave structure of Elliott and is one of the favorites in the determination of retreats and reversals of the market based on the analysis of past figures of the chart. It is usually combined with the Fibonacci lines (numbers).
Zigzag works fine when an apparent direction of price movement emerges on, at least, three time frames: on the daily, 4-hour chart, and 1-hour chart. Consequently, all entry signals submitted by Zigzag will be as accurate as possible.
This indicator is usually used for the long-term timeframes and day trading strategies. For scalpers, use of this program is not like that. Most importantly, it is almost impossible to filter out all the noise of the trading channel, besides scalping is often used during flat. To test the indicator with your strategy, download this free trading robot on the MTDownloads website.

 English
 русский


