Force
The Force indicator is a popular technical tool used to identify volume and dynamics of the price movement. Alexander Elder developed the trading indicator. The author presumed that estimation of the strength of every move must consider its direction, distance, and volume. So, the algorithm of the tool is based on the following simple principles:
- The price force is positive if the close prices grow and vice versa;
- The strength increases proportionally to dynamics of the price changes;
- The more the strength is, the higher is the volume.
Below we describe the main features of the trading robot and different working methods. Free download of the latest version of this Force Index is available at the MTDownloads website.
Application of the instrument
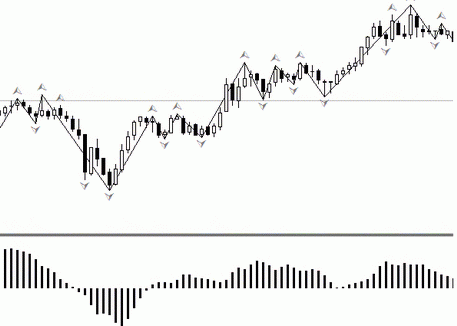
This trading assistant provides relatively comprehensive information as it provides a trader with a particular understanding of the current situation with prices in all possible characteristics. On the chart, it is displayed as a dynamic line oscillating around the zero axes.

When the price level goes up, it shows the superiority in the number of buyers in the market. The basis for calculation is the simple economic tenet: the more you buy (increased demand), the more sellers "bid up" prices. The more the price increases, the higher is the probability of the large buyers’ presence, which stimulates the growth of the indicator.
When the graph turns down, the moment of sales is there. Accordingly, if the figure goes downwards, the greater is the predominance of sellers in the exchange.
Identification of the trend using the Force Indicator
The Force Index is often used by traders to determine the trend direction. It is done quite simply: when the Force Index has a positive value, the market has a positive trend. Downward movement below the level of "0" indicates a downtrend. When the indicator oscillates near zero, most likely, on the exchange there are small fluctuations.
By setting up a long timeframe, it is possible to determine the long-term trend, so if you want to trace the movement in a short period, you have just to change the settings. If the indicator calculates values for extended periods of time, it will smooth out the line, and this will lead to rarer intersections of the zero level. Reducing the timeframe will increase the sensitivity of the instrument, and it will show every change. In this case, the risk of receiving false signals will increase.
The author recommended to use 13 periods, and this value is the default.
How to trade during divergence?
Divergence is a regular phenomenon for any trading indicator. It occurs if the divergence of the indicator line and the prices indicate about the trend reversals. When the neighboring price minimums drop, the minimums of the indicator go up (the lines go as if attracted), the trend will reverse soon. When the highs of the price increase and the same indicator dots go down, it says about the probability of the trend reversal.

We want to warn that divergence trading is not quite safe. While receiving the signal to open orders, you must wait for confirming signals. It is recommended to connect one-two indicators to the current schedule that they block false signals or smoothed small movements. If the price has great movement force, the graph will not react immediately to the change and will still move in a given direction for some time. It will reduce the accuracy of the signal. Probably, another tool will react in time, and you will not open a false trade.
Force Index Signals
These are all the signals you need to react to:
- The signal to open a buy order indicator appears if the indicator goes below the zero level while the price increases. You need to buy if the line crosses the "0" mark;
- The signal of a strong uptrend appears if the indicator goes up. As we have said, if the index moves in the same direction for a long time, it could be a false signal. In this situation, it 's hard to immediately react to the changes.
- The signal to open sell orders appears if the indicator is above zero during a downtrend. One has to enter the standard scheme when the Force Index crosses the zero level and stays there;
- The signal of the continuous price drops appears if the tool "draws" all new local minima.
- The signal of the price direction change appears during divergence.
As you can see, the tool is quite simple for application. If correctly set, it is possible to earn good money without any individual efforts. Download the Force Index for free from the MTDownloads website right now and try it with your trading strategy - maybe this will be a winning tandem.

 English
 русский


