Percentage Price Oscillator (PPO)
Percentage price oscillator is a technical analysis tool that shows the correlation between the two moving averages and transforms price into the percentage. To download PRO for free, you can go to MTDownloads, where the installation procedure of the tool is described in details.
Stock market players are primarily interested in prices of stocks and other securities, namely, their fluctuations at selected time periods. It forces players to stay focused because the financial market is a very dynamic trading platform. Some stocks fall in price, while the price of the others rises. If you buy or sell an asset in time, you can get a good return on the price difference.
The course differences determine profit on the stock exchange. To consistently get a profit, market participants choose strategies that are divided into bullish and bearish.
- When the assets are bought at a lower price and are sold for the greater price, this strategy is called the bullish.
- When the assets are cheap and are bought for a low price, these strategies are called the bearish.
Where and why РРО is used?
To determine the market situation over a given period, traders use price oscillators (PO) to save the time and automatize the process. An oscillator means the ratio of technical analysis and forecasting in the Forex market. There are analytical (APO) and percentage (PPO) oscillators. APO show the difference between the prices in points, and PPO - in percentage.
Percentage price oscillator is one of the PPO used for assessment of the situation in the trading area as a percentage ratio. It is a series of oscillating curves in a particular range of time and displayed graphically as a histogram with a signal line fluctuating around the zero level.
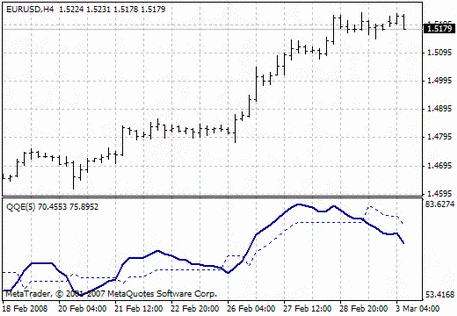
The oscillator is depicted below or on a separate screen in the form of graphic lines. PPO is usually configured to 12 and 26-day exponential moving average (EMA). To calculate the MA (moving averages), you should apply the close price to the signals. The period is changed by the user.
This technical tool shows the percentage of subtraction of two MA with different periods to the value of MA with a high number of periods. Afterward, it compares the results. The higher the stock or currency price is, the higher is the price point of the oscillator, and vice versa.
The intersection of the zero level of the indicator line bottom-up and top-down is the primary signal for investors. The signal to buy an asset occurs at the moment of the intersection when the short EMA goes above the long EMA. If short moving average goes below the long MA, it is a sign to sell an asset. If intersection happens multiple times and the lines move in parallel to zero, it confirms the right sign.
Features of the indicator
PPO determines the areas and separates the pivot points from the lateral inclination moving in the range from 1 to 100. On the chart, the oscillators draw various figures: squares and circles, which are used by investors for technical analysis.
It uses the following formula: ((СС short – СС long)/СС long) × 100%
PPO compared to МАСD oscillator, which is often used in tandem with the considered robot. MACD selects a temporary pair of the moving averages with the changing periods, while percentage price indicator uses MA of 12 and 26 days.
PPO and MACD display convergence and divergence of the two EMA anticipating the situation. The divergence shows how short and long-lines of the oscillator diverge in the incoming and outgoing flow. Convergence, on the contrary, shows the converging curves.
Percentage oscillator shows a positive trend when the slower line is under the fast mobbing average. If the distance between the lines increases, the market will expect a strong bullish trend, which is a signal to sell the stocks. When the opposite situation takes place, the oscillator shows a negative value. It suggests that "bears" need to buy cheap shares.
A positive value takes place when PPO is above the signal line, while a negative value appears when the indicator is below.
Pros and cons
Price and simple oscillators are similar, but it is necessary to understand there are important differences. The percentage differs from the price position. Percentage oscillator is better than other price indicators because it monitors two moving averages. It helps analyze the movement of prices in time intervals without the emphasis on the exact values of the asset cost.
When using PPO, expensive and relatively cheap stocks are compared. If the value is 8%, it means that a short-term average value is 8% higher than a long-term value.
This indicator works correctly during directional movement of the prices and accurately assesses the condition of the market. It is quite sensitive to the slightest changes in the market so that it can give false signals and it is not worth trusting it always. Overall, it should be tested on a demo account before application of the indicator to your strategy. Try to put in parallel with other technical tools. Once you see the trading assistant in work, you can safely rely on its values and apply it to real trading.
On the MTD website, you can download PPO for free and see the other tools from this group to pick up a couple for RRO.

 English
 русский


