Parabolic SAR
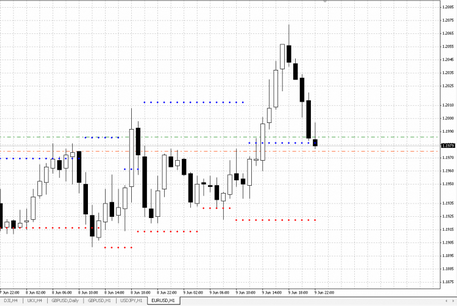
Parabolic SAR is the trend tool that shows the market movement direction. It exists in the form of points drawn on the graph. The indicator shows the market changes and quotes. Parabolic brings a point when strengthening/weakening of the market occurs.
Below we describe the key features of the tool and methods to work with it. To test the trading robot for your strategy, download Parabolic for free on the MTDownloads website.
Description
Parabolic SAR is a classic technical indicator among the standard tools of each trading terminal. This tool is used in many trading strategies to work in the financial market as well as an independent assistant. Based on the Parabolic indicator, scripts and automated logarithms were developed to use them in the strategies.
It is easily operated:
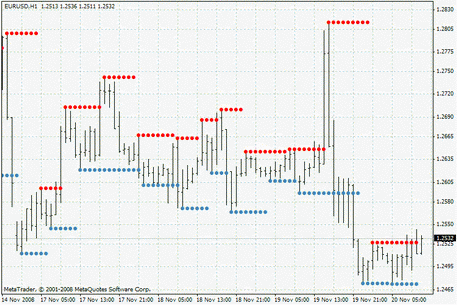
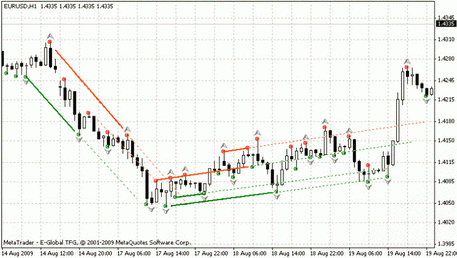
- If the market has upward motion, Parabolic will show the points below the market indicators (depending on the graph used by a trader, points are drawn under the candles or bars);
- If the market has downward movement, Parabolic illustrates points over the candles/bars.
The number of points depends on the strength of the trend or impulse. The more intense the movement is, the more points are drawn by the tool.
Configurations of the indicator
After installation of the instrument in the trading terminal, a user can change the parameters of the indicator’s work. The default step is 0.02; the maximum is 0.2.
In general, Parabolic does not require additional settings, but depending on his personal preferences; a trader can:
- change the color of the Parabolic SAR dots (green by default);
- configure the view (the size of the Parabolic dots) to make them brighter and bigger for a better visual perception.
Formulas
Depending on the length of a position, the indicator is calculated as follows:
Long positions
- SARn = (High (n-1) — SAR (n-1) * AF + SAR (n-1).
Short positions
- SARn = (Low (n-1) — SAR (n-1) * AF — SAR (n-1).
Explanation:
- SARn - value of the indicator for n period;
- High(n-1) - the highest price of the previous period;
- Low(n-1) - the lowest price of the prior period;
- SAR(n-1) - Parabolic’s value of the previous period;
- AF - empirical coefficient, step, an indicator of acceleration.
Maximum
In practice, the acceleration factor initially is set to 0.02. Afterward, it is necessary to calculate it according to the formula:
- AF = 0.2 + n * 0.02
Explanation:
- n - quantity of the used periods;
- 0.02 - step, at which the price changes its value;
- 0.2 - maximum.
Parabolic depends heavily on a step of the price change. If you increase a step or vice versa, the line of dots changes the angle and gets closer or farther from the candles/bars.
If you configure a step of the tool with larger than 0.02, in this case, it will be convenient to track the general direction of the market movement (the trend or momentum). But, on the other hand, indicators will be less accurate, since the points of the Parabolic line will be far from candles or bars.
Features of the indicator
The name of the reviewed technical tool means "Stop and Reversal", which is a feature and an advantage of this indicator. Parabolic builds a line of dots until they come into contact the values of the market prices (the candles, or the bars). This event is a signal to close trades opened in this direction.
Explanation
The Forex market has the downward movement, and a deal to sell is open. Parabolic builds a line of dots on the price chart. When Parabolic SAR touches the candles, the Sell position must be closed. The indicator showed that the market momentum has faded and the market reversal may begin.
Application
-
To close positions
To apply this tool, one needs to close orders when the Parabolic values cross the market prices.
-
Reversal method
When Parabolic SAR touches the market prices (candlesticks or bars), the open positions are closed, and the orders are changed to the opposite direction.
-
Entry points
This approach is considered the most efficient use of the indicator. To determine a more accurate market entry, you need to use Parabolic SAR with other technical indicators. They will confirm the results and block spurious signals. It is often used with ADX, which acts as an additional filter. Download ADX frees on the MTD website and find instructions to join the tool to the trading terminal.
Disadvantages of Parabolic SAR
As mentioned above, this instrument is used during a trending or pulse movement. If the market is in the consolidation area or has a slight change, the indicator will show a significant number of false signals. The dots will be formed in small quantity, and such lines will often change its direction. A similar situation is observed in the areas of little market trends.
Parabolic SAR is very easy to understand and apply. It is suitable for traders of every level and has full application. If this tool is used with the other trading robots, it gives high rates of return. Various modifications of Parabolic allow you to use it more efficiently and make money in the financial market.

 English
 русский


