Murrey Levels
The Murrey Levels Indicator is a tool for market analysis, which is used for trading in Forex. The author of this indicator, Thomas Henning Murrey, took a keen interest in the William Gann's methods with the aim to simplify them as well as to remove all bulky mathematical calculations. Thus, the radii of the Gann's circles were transformed into lines on a graph, and traders got a convenient tool, which helps find the points to open and close position as well as to predict the future events in the market.
Building the Murrey Levels
It's necessary to follow certain rules while determining the most important points to create the levels. The points are constructed within the time periods no less than 4 hours (H4) taking into account the critical extremes of the recent period.
Further, the entire graph from the price minimum to maximum is divided into the horizontal levels with an interval of one-eighth. Additionally, a vertical grid is plotted on the chart. By the fractal nature of the algorithm, if the period is increased, the values of the lines will change too. It shows the correctness of the ongoing constructions.
Initially, traders used to build these levels themselves, conducting the complex mathematical calculations, but nowadays, any trader can download the Murrey Levels Indicator for MT4, which will create the levels automatically through the ready-made software algorithms.
Before starting work with this indicator, it is necessary to make adjustments of the period and the P parameter, which determines the distance between the straight lines on the graph. By default, the period D1 is chosen for the indicator, and the value of P equals to 64. However, some bidders choose a larger value of P for readability of the indicator.
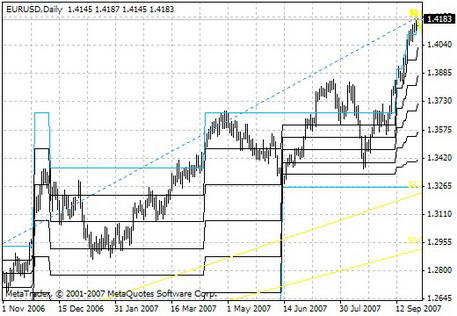
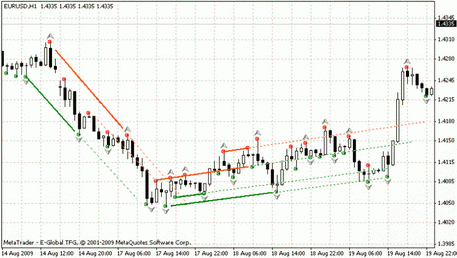
Once the required currency pair is selected and the indicator is added to the chart, a trader will see the following picture:

Now the price on the graph is divided into values from 0/8 to 8/8. When the price moves up, it will go in a plane of these levels. Each of them has its properties, which depend on one another. The values of some levels are repeated. It allows to determine a simple pattern of the plane division:
- 4/8 - central area;
- 0/8-level is equal to the level of 8/8;
- 1/8- level is equal to the level of 7/8;
- 2/8 corresponds to the level of 6/8;
- 3/8 corresponds to 5/8.
In case the price will get above extremes, the creator of the indicator made additional levels, built above 8/8 and 0/8: the levels of +1/8, +2/8 as well as -1/8 and -2/8, respectively.
Use of Murrey Levels
Naturally, the price on the chart doesn't move accurately according to the levels. These lines serve as predictors of the future market events. A trader should take into account the following: when the price reaches any level, the indicator displays the probability the event will either occur or not.
- The +2/8 and -2/8 levels are the lines of support and resistance. If the price breaks through these lines, the graph is rebuilt on the new range.
- The +1/8 and -1/8 levels are also the support and resistance levels. If the price reaches these lines, the price is likely to turn around.
- Levels of 0/8 and 8/8 are key areas of the trend reversal. These lines serve for closing the previous positions or for opening the new ones, depending on the direction in which the trend moves.
- Levels of 1/8 and 7/8 are relatively weak zones. The price there, as a rule, moves to the side, opposite to the levels of 0/8 and 8/8.
- Levels of 2/8 and 6/8 are the support lines. The price often rebounds from them in the direction opposite to the movement at the levels of 0/8 and 8/8.
- Levels of 3/8 and 5/8, as a rule, serve as a corridor of the price movement, where it can move for a long time, occasionally crossing the central level of 4/8.
- The 4/8 level - the primary resistance and support level. When price crosses this line, the position in the trend direction should be open.
This tool is perfectly combined with the indicators of the wave type: Elliott's system and Elder's screens as well as the Fibonacci lines.
Summary
Murrey Levels are based on proven mathematical algorithms and are very flexible. Even in case the price breaks through the extreme levels of -2/8 and +2/8, the indicator chart will be rebuilt automatically, taking into account the new range. This tool will be highly appreciated by traders who prefer a cautious forecast. It is worth noting the high accuracy of prediction, which makes it an especially convenient tool for simultaneous use along with the other indicators.
For this indicator, a trader must have a good understanding of the properties of those periods, in which the movement of the price goes. Therefore, we recommend you first test the indicator on short time frames before starting a long-term trade.

 English
 русский


