Triple Exponential Moving Average (TRIX)
A quiet convenient trend indicator, TRIX, allows you to eliminate the excess noise on the market quickly, as well as to monitor the closing prices for a certain period. At the same time, it remains very sensitive even to the slightest market fluctuations. If the calculations are made correctly, it signals about any changes successfully.
What is TRIX?
TRIX stands for Triple Exponential Moving Average. This is a kind of oscillator, with the main task of displaying the change in the speed of a triple exponentially smoothed average (EMA).
Mr. Jack Hutson was the creator of such an instrument and, at the same time, the author who published the information about such a type of tool first, in 1980.
This indicator allows you to completely eliminate the market noise and short-term cycles, identifying either the presence or absence of a market at a particular moment of a trend.
At the same time, it gives the necessary trading signals within a clear downward or upward trend.
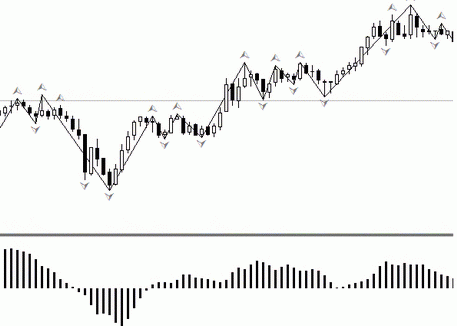
It looks like an ordinary curve with a set of values of the given time intervals.
A distinctive feature of the TRIX is the absence of the oversold nor overbought levels.
Features of the use of the TRIX
If you follow the TRIX movement carefully, you will need to understand clearly, what does each of the modifications mean, and how can this affect the current market situation.
Among the main features of such an indicator are the following ones:
- If the signal line crosses the main one at the bottom of the graph, then this is considered an obvious clue to the purchase deal. The intersection at the top makes it possible to think about sales;
- If the TRIX has fallen below the zero mark, there is a downward trend on the market;
- A gradual, or sharp jump of the curve indicates the prevailing upward trend;
- The intersection with the zero line is mostly a push to buy or sell. However, experienced traders suggest not to rush with the conclusions, and take into account such changes only in case they receive an additional confirmation by the other technical analysis methods;
- Don't forget about the oscillation amplitude of the indicator. The accumulation of many highs and lows can cause the price to jump, making a new impulse. This indicator also helps to identify the situation on the market during the previous cycles. To make it possible, you just need to calculate the distance between the top of the chart and the base;
- Analytics recommend never take into account the intersection of lines during the flat. These are all just false signals with a probability of 99%.
A competent and timely interpretation of the TRIX will help to avoid the trend lines breakdown, as well as the the breakdown of trading range during the trend.
How to recognize the divergence with the TRIX?
This oscillator type also has found an application in the identification of the market divergence.
Since the divergences are divided into the bull and bear ones, the indicator can give completely opposite signals for both of them:
- At the moment when the curve is increasing compared to the previous value, the prices are reduced to a minimum. This is a signal of the bullish divergence and may be the reason to buy;
- During the bearish divergence, the reverse situation develops on the market: the indicator goes to a decline while the prices are increasing. This trend is short-term and signals the need for a sale.
However, it's possible to make the cardinal decisions, based on the single divergence indicator, only in case when the trader can predict the forthcoming trend reversal with a 100% confidence.
What should I remember calculating the TRIX?
The main condition for the accurate indicator results are the correct oscillator parameters:
- If the value is 'true', the trader will receive signals about the intersection of the main and signal lines. You can remove that signals by choosing 'false';
- Trix Period. This setting adjusts the period of the indicator, which is required to construct the main moving average;
- Count Bars allow you to count the candlesticks, which are taken into account analyzing the past periods of the indicator;
- Signal Period - this option sets the additional period, called the signal line of the oscillator. It must be less than the period of the main line.
If the period of the indicator is set to 18, then the TRIX calculation will be performed in the following sequence:
- At the beginning, the EMA1 is calculated at the current closing price, with the specified period;
- To obtain the EMA2, the exponential moving average of the EMA1 is calculated;
- The EMA3 is calculated the same way;
- The final TRIX value is obtained by subtracting the EMA3 of the current and past days. The result is divided by the EMA3 value of the previous day;
- The finished percentage is used to make the graph.
Although this oscillator is considered to be one of the most accurate, it's recommended to use the TRIX along with other indicators or technical analysis methods, to filter out the market noise qualitatively.
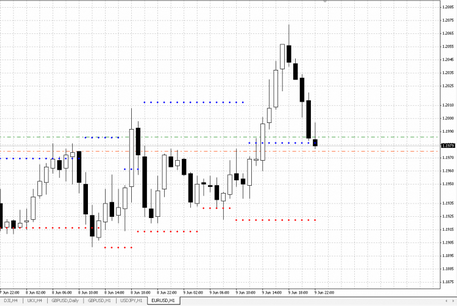
To improve the results of trading, combine this oscillator with the Parabolic SAR channel indicator, which perfectly fixes the breakdowns within the trend ranges.

 English
 русский


