ZoneTrade
Zone movements indicators highlight the periods of a trend’s growth or decreases and determine the moments of insignificant price fluctuations or flat. Below we will consider the application mechanism for this trading robot in details.
The times of the manual graph analysis has sunk into oblivion a long ago, and to date the trader has each opportunity to automate his trading, earning a lot of money. Various technical tools were invented, including scripts, indicators, advisors to make it easier for a trader to analyze the asset price movements.
Scripts feature the possibility to perform several actions simultaneously: for example, close all the losing orders, or close all orders at a particular time. Advisors automate trade at all: these are specially written programs that can open and close orders independently, by the built-in algorithm. And the indicators directly help the trader to make the trading decisions by himself.
One of the most common sales assistant groups has been developed by Bill Williams, a trader-analyst. The author had a peculiar view of the market analysis, and argued that there is no point to consider the price levels with the magnifying glass - it's enough to see the direction and the price drops. The ZoneTrade indicator is one of the tools developed to support such a strategy. If it's not installed in your trading terminal by default, it can be downloaded for free on the MTDownloads website.
What is the ZoneTrade indicator?
Zoning allows the trader to understand the direction the price is moving in, and whether there is a trend at all, without going deep into the price values. A significant advantage of the indicator is that it can be used on entirely different time frames and trading assets, depending on the trader's preferences.

The forecasting of a trend movement is the chief trader's work, which makes it possible to understand whether it is necessary to open a deal, which order size is optimal, and where to set the breakeven level. Trade in the flat is very risky, so most of the indicators work with trends. The ZoneTrade indicator copes with this task great. It accurately displays the current position of the market, blocking the false signals, and can also be adjusted to any trend-trading oriented strategy.
The principle of the indicator
The trading robot is developed by two indicators, previously invented by Bill Williams, which is AO and AS. The first one (Awesome Oscillator) considers the productivity and direction of the market, determines the type of the trend, and the Acceleration Oscillator displays the acceleration of the market. Using the ZoneTrade, the tool will display the synthesized result from these two robots.
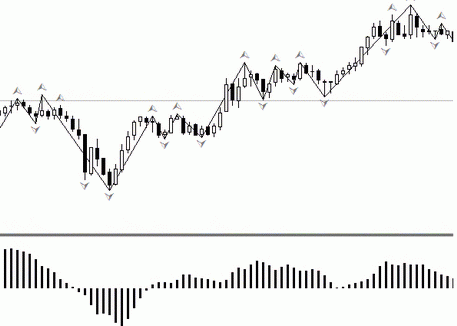
The green zone is formed if the corresponding areas of two histograms are also green. Similarly, the bars are colored red. If the color of the bars on the AO and AC graphs doesn't match, the ZoneTrade will draw a gray area. The visual algorithm looks like this:

Taking into account that the ZoneTrade indicator is based on the work of two other robots, it entirely signals by itself. However, this doesn't exclude the possibility of several robots use. The Bill Williams' indicators are adequately represented on the MTD website, where they can be downloaded and installed for free.
Using the B. Williams' tool
The work with this technical tool and a transaction opening is based on the information received. First, we draw your attention to the fact that the robot signals can be redrawn, so there is no need to react to the first signals immediately since there is a high probability of price values to change.
The order should be opened only by closing the candle, and it's better to exit the position when the trend is drawn in gray or yellow.
Signal for purchase
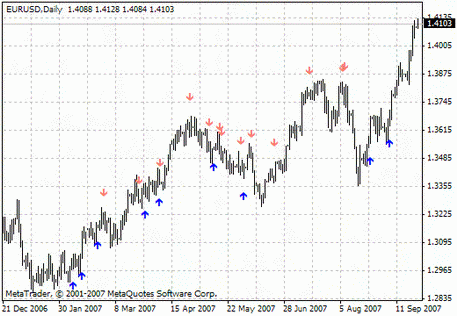
It's recommended to buy assets when the closing price of the second candle has exceeded the previous indicator, and it's green. An example of such a signal is shown in the graph below:

Signal for sale
Bill Williams recommended opening the orders for the sale when the indicator is displayed in red, and the trend has declined. That is if you see a red candle and the closing price of the second candle fell below the closing price of the previous one, then open a short position. Here is an example of the sell signal:

On the Forex market, the presented technical analysis tool perfectly demonstrates the Bill Williams' approach to zonal market division and confirms its effectiveness once again. Due to the clear visual display and a sophisticated algorithm, the ZoneTrade indicator is one of the primary trading tools for trend analyzing in the market. It simplifies the trade with this method significantly.

 English
 русский


