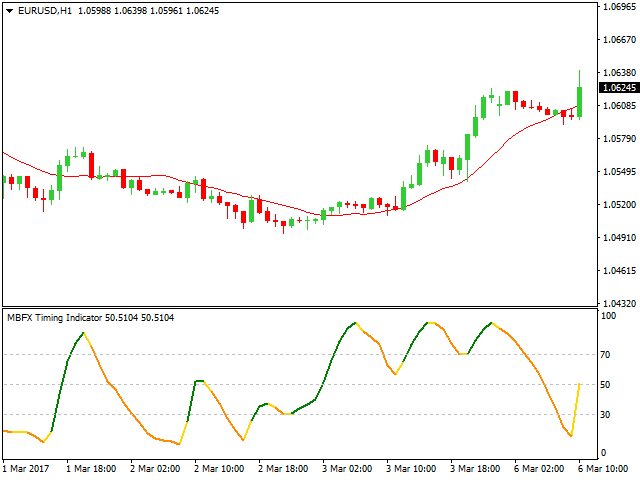
Stochastic RSI
Stochastic RSI combines two of the most popular tools: it worked as a classic Stochastic but calculated according to the indications of RSI. As a result, the sophisticated software responds better to price fluctuations and does not have any slowdowns. Below we describe key aspects of the oscillator. You can test the bot on your strategy for free on the MTDownloads website. There you will find instructions to install the program in the MT4 trading terminal.
Due to advanced technologies, traders get some new trading assistants. Some of them provide fully automated trading, others help to avoid routine actions, but the biggest piece of software belongs to indicators. Testing robots, Forex traders seek to include them into your strategy, so improved versions of the known bots appear frequently.
Stochastic indicator along with RSI are two important market participants, and it is better to connect them together and to complement with the other tools of technical analysis.
Emergence of advanced oscillator
The Forex market is a very volatile marketplace. Therefore, technical analysis is quite convenient to and detect even the most minor fluctuations. Due to the intersections of the two oscillators, Stochastic RSI performs this function without lagging. Among the shortages of this indicator, one may identify only a large number of false signals due to the mentioned sensitivity to minor fluctuations in the price level.
The idea of such an intersection first appeared when Stanley Kroll and Tushar Chande considered technical tools. The authors relied on the fact that RSI is in the range of 70-30 due to its calculation algorithm and it does not help traders to catch the optimal moment to enter the market. In its turn, Stochastic always fluctuates in the overbought and oversold areas. Combining the principles of these two instruments, the formula for Stochastic RSI finds the overbought and oversold zones. You can download the component tools separately on MTD website.
How to use the indicator?
Since the tool works according to the Stochastic formula, a trader will see the two lines that oscillate between overbought (80 - 100) and oversold (20 - 0) areas. The level of 100 is fixed when the price reaches a new maximum, and the zero level is displayed during the drop to a new low.
As for trading with signals, a tool remains in the extrema positions for a long time due to its sensitivity. It is recommended to open the order in turning points. Here are the main rules:
- Buy order must be set if the line rises above the oversold zone;
- Sell order is placed when the tool goes to the overbought zone.
- A trader should focus on these signals if both indicator’s lines were in the 80 and 20 zones. Graphically, it is shown in the figure below.

It is essential to understand that Stochastic RSI is not to use as a primary signal indicator. First, it must be used in tandem with another instrument, and secondly, it gives a lot of false signals due to its sensitivity. Therefore, it is known as a trigger for an action.
Secondary signals
In addition to the basic rules of use, it is possible to trade on the intersection of the tool’s lines. Here are several options:
- try to open orders if the lines ‘clash’ beyond the levels of 80 and 20;
- Optionally, you can add line 50 and buy the asset when crossing that mark. Each trader chooses which line to navigate.
However, this method does not work 100% because the indicator is based on another instrument without independent calculation.
In general, hybrid indicators are significant for traders as they accumulate the best quality components of the formula and thus show higher efficiency. One such tool is much easier to link with another trading assistant. Due to this result, a trader will receive the actual data. To apply Stochastic RSI to your trading strategy, just download it on the MTDownloads website and then install in the terminal.

 English
 русский


