Market Facilitation Index (MFI)
Using market facilitation index allows a trader to assess the performance of the currency exchange, that is, to determine how the area of liquid about the financial instrument in question. In the MT4 terminal, the indicator is presented as a histogram with bars 4 colors. Below we consider the mechanism of application of this trading robot.
To trade on the foreign exchange market successfully, traders conduct a fundamental and technical analysis. The first one finds out the factors that affect the value of the financial instruments, and the second one monitors the price movement. A major market survey includes the analysis of the world news and important events in general, which can affect the value of the state currency and cause the quotation fluctuations on the currency exchange.
As for technical tools, there is a significant number of them - including advisers, indicators, scripts, etc. They integrate into the trading platform and track the price levels, notifying the user about certain events, due to the built-in algorithm. Technical indicators help the trader to determine the optimal market entry points and open a lucrative deal.
A significant contribution to the technical analysis of the market was made by Bill Williams, a trader who created the corresponding group of indicators. One of the author's inventions is the Market Facilitation Index (abbreviated BW MFI), which displays the dynamics of price fluctuations for each tick - a single change in the asset price. According to the author himself, and also based on the traders' feedbacks, this tool displays the market situation much more efficiently than the other indicators. Therefore, the BW MFI is one of the standard technical tools of each terminal, and you can download the latest version of the indicator for free on the MTDownloads website.
Using the index
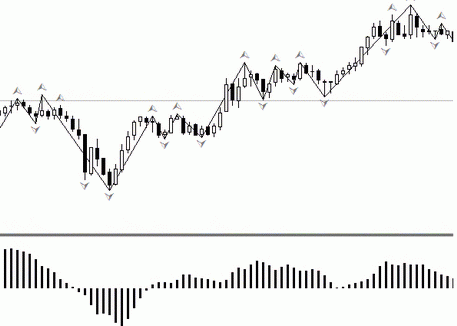
As a result of the instrument application, the trader will simultaneously analyze the transaction volume at the top of the graph window and the indicator values at the bottom. This trading robot can be used on several graphs at once.

The author of the indicator drew attention to the fact that we don't need to study excessively each new tick, it's quite enough to analyze the amplitudes and price drops on the upper graph, with the corresponding color designations on the histogram below.
The trader must pay attention and respond appropriately to the following changes:
- If the indicator values grow with the increase in the transaction volume, it means that participants have arrived at the market, and their trading activity contributes to the growth in the exchange rate. There is a trend that will grow fast.
- When the indicator bars go up, and the line graph doesn't show a trading volumes increase, then now speculators are in the market;
- If both indicators drop in the upper and lower parts of the chart simultaneously, the activity of market participants also falls;
- If the index value goes down, and the same time, the volume of transactions increases, this situation indicates an intense competition among buyers and sellers. At the same time, the forces on both sides are equal, so the price doesn't change much.
The market research strategy with the use of the MFI is based on the following fact: when one of the trading parties loses the interest in such a market, the trading volume also falls, and the liquidity of the trading platform suffers.
To understand the indicators quickly as well as to correlate them with the transaction volume, a trader should test different situations, time frames, use a tool with various currency pairs, etc. The understanding of this technical analysis trend will be formed after you'll see the behavior of the market in different situations - then you'll orient, which transaction to open and whether should it be done, or not, in certain conditions.
How to read the BW MFI data correctly?
The indicator is considered super efficient because it gives accurate indications at any time intervals and can work on several graphs simultaneously. The application of this tool has managed the trading terminal developers to built it into the MetaTrader4. Along with this, quite often the indicator is updated, so if you need to install a new version, you can download it for free on the MTD website.
Once again, we draw your attention to the fact that, considering the market productivity index, we should pay attention to the price change, not to its absolute indicators. As for the study of the columns on the histogram, we must be able to "decode" the colors correctly. By default, they may be green, brown, blue and pink, but the settings can be changed depending on the personal preferences.
The green color is the trend indicator. If this column grows, then the trader should open trend positions only, and close the opposite positions. The growth of the green column indicates that more traders enter the market, and also that they stimulate the trend growth.

- Brown color indicates a fading trend. In this case, it's better to close the trend positions and open the new orders.
- Blue is the color of the dynamic trend movement, which is not supported by the corresponding trading volume. Usually, in such moments, big players try to seize the market but don't make any significant changes. It is just an indication of the active trading, and the transaction at this time should be opened very carefully.
- The pink column says that the trend is over and the market is in a flat state. In this case, the trade volume will increase depending on how the new participants will interest in transactions.
As you can see, deciphering the indicator signals is very simple so that the tool will be useful for traders of any level during the transactions with various financial instruments. Also, we recommend using the indicator with other robots to determine the more accurate market situation.

 English
 русский


