Commodity Channel Index (CCI)
Commodity channel index (CCI) is a tool of technical analysis that determines overbought and oversold assets in the Forex market. The robot shows good results when paired with the Keltner Channels, Bollinger Bands, and Envelopes.
Initially, CCI was developed by Donald Lambert to find areas with the highest and lowest prices for commodities. The robot displays the cycle of rising and falling prices. However, analysts have noticed that the use of the robot is possible for financial assets because the price also has the cycle essence. As a result, this trading assistant was upgraded to work in the foreign exchange market, and now it is among the most popular technical analysis tools of Forex.
Free download of the commodity channel index is available on the MTDownloads website. Besides, the detailed algorithm of the program installation is described. On this portal, you can get acquainted with other trend indicators and choose a tool to work with CCI.
Application of CCI
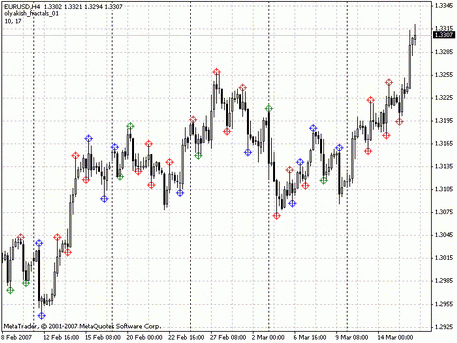
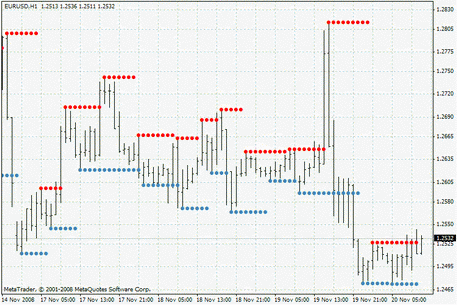
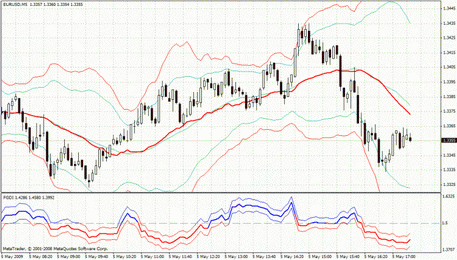
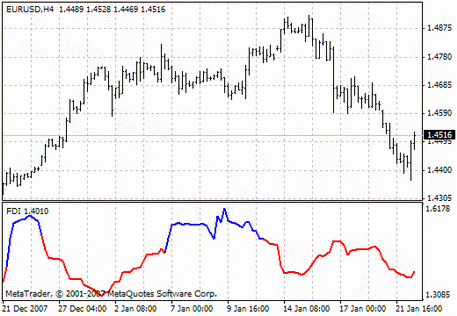
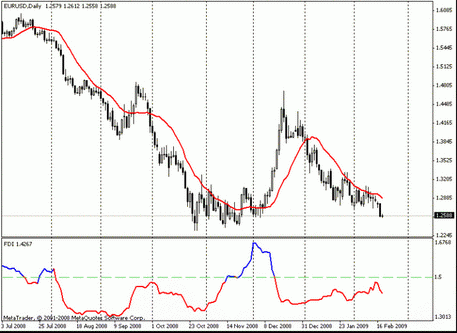
On the chart, the indicator looks like the line oscillating around the zero scale. The key levels are the positions of -100 and +100. When the asset price reaches a new high or low, CCI is out of the specified levels, which is a signal to enter the market. In the figure below, such zones are shown in red and blue lines, respectively.

The author of the trading assistant described the work methods in the following way:
- If the line is above $100, the market has a strong uptrend, and it is time to open the buy orders;
- If the line crossed the -100 mark, it's time to sell the assets.
In general, the indicator characterizes the overbought (above +100, when prices are higher than usual) and oversold areas (the line is under the mark of -100, the price is very low). However, after extensive testing of the indicator, it was found that CCI can be applied to detect price reversals. Also, the tool is also characterized by the discrepancy between the price lines and technical tool.
At the moment, the tool is used to obtain the following signals:
- the oversold and overbought assets;
- the divergence of price levels and CCI indicator;
- trend reversals.
Zones of active trading
As noted above, the indicator’s crossing the level +100 or -100 in the direction of increase and decrease, respectively, indicates extremely high or low price of an asset. It's a temporary condition. When the index enters the range again, the market will return to its usual direction. These periods quickly end up because of a significant number of speculators. They only manipulate with supply and demand and stabilize the market. Thus, when the indicator is in the range, getting a profit becomes very unlikely.
It is easy to understand. While the price is too high or too low, buyers and sellers have a chance to make deals at the best prices. At the other times, it will be challenging to do. When the CCI line is blue or green (based on the picture above), it is a high time to make deals at the highest price and buy at the lowest.
Discrepancy of the price movements and index
Divergence is an excellent indicator to predict future price movements. If the index rises and the price gets low, the latter will go up soon and vice versa.
Reliable sign is the intersection of lines, when CCI falls from the field of +100 or higher and the price increases. By analogy, it is possible to buy the asset when the price is crossed.
Trend change
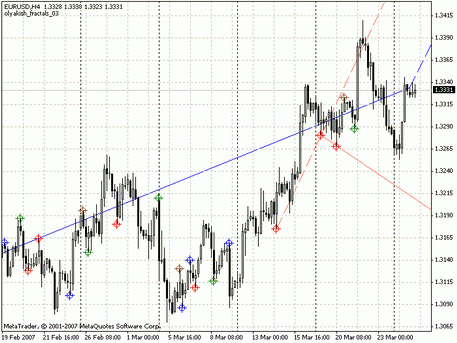
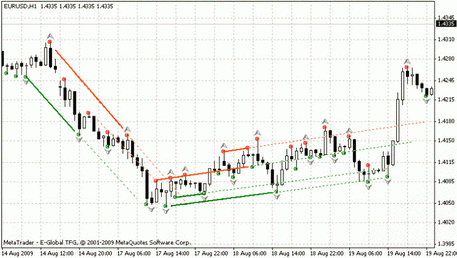
Traders have learned to identify reversals of trends using CCI. If using a trend line, it is also possible to see the best moments for market entry.
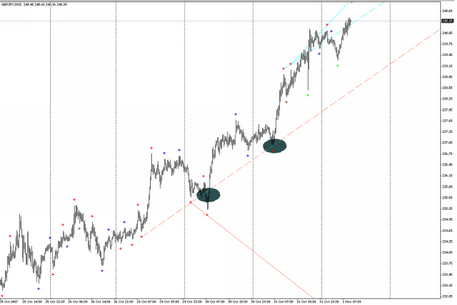
The intersection of the trend line and the index indicates a change of trend. Accordingly, when downtrend and upward index intersect, it is a signal to buy, and vice versa.
Conclusion
Commodity channel index, created to work in commodity markets, is actively used to seek zones of high and low prices as well as moments of the trend reversal. Like the other indicators, it should be applied with different technical analysis tools to get more accurate information.
To see the full list of Forex robots and download them, go to the MTDownloads site.

 English
 русский


