Channel
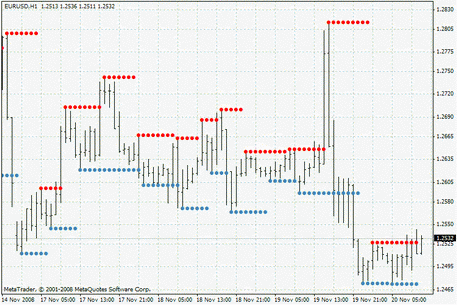
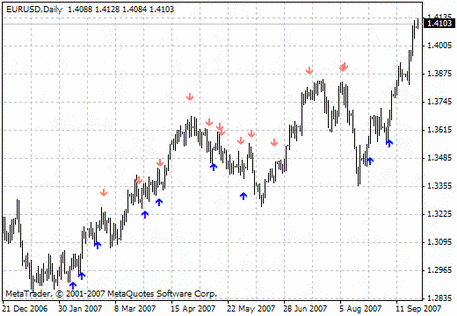
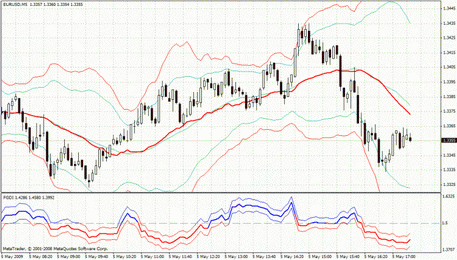
Price channel indicators are technical indicators used for trading in Forex trend market. In fact, working with these assistants is a whole trade concept. In this case, instead of one trend line, two are drawn: the upper and lower. The indicator signals when the price breaks one of the trend lines, and this serves as the optimal point for entering the market.
Channel indicators are successfully combined with support and resistance lines and candle indicators. It is also worth noting that successful trading through channels requires certain practices and a correct analysis of the market structure.
How do channel indicators work?
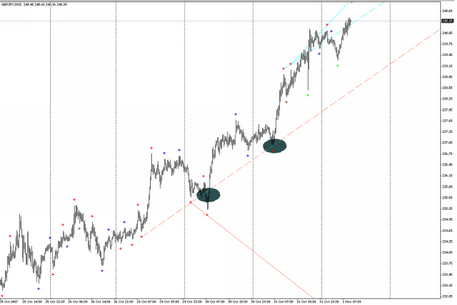
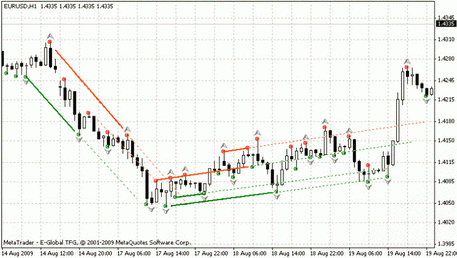
The way the channels are displayed is similar to how the trend lines are. They are based on two consecutive minimum or maximum points of the price fluctuations. For most channel indicators (Fibo channels, standard deviation, and regression channels), two minimums or two maximums are required. In the case of the equidistant channels building, the key points are selected by the minimum/ maximum/minimum, or the maximum/minimum/maximum as well.
It should be noted that the channel indicators do not support the resistance and support levels installed on the slope. With the maximum/minimum/maximum fluctuation points, a downtrend is formed, and the fluctuation points at the intersection with support and resistance levels.
Channels in use
In the MT4 trading platform, the built-in channel indicators are straightforward. Select the "Insert," then select "Channels" from a drop-down list and you will see a list of channel indicators installed.
Trading with channels provides an opportunity to understand the market structure better, compared with the trend instruments. Long and short positions begin at the lower and upper ends of the channel, depending on the angle of the channel. Also, transactions can be made after the channel breakdown and strong support and resistance level installation.
As the price turns, a trader can observe a slight correction at the upper end of the channel. It gives an excellent opportunity to sell at a given support level.
In the channel settings, it's important to set the correct period, depending on the trading method used. For example, in the Price Channel indicator, the default period is 14. As the period increases, the indicator will provide calculations based on the longer time interval. On the graph, in this case, the channel will look wider. If the trader prefers the scalp, then the period can be reduced. Visually the channel will be narrow.

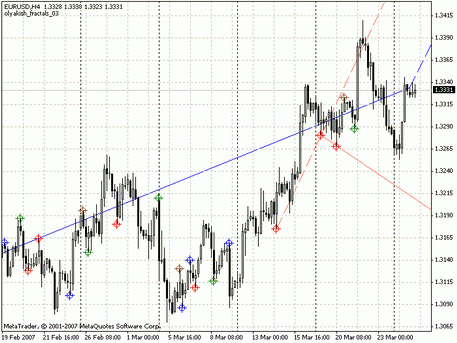
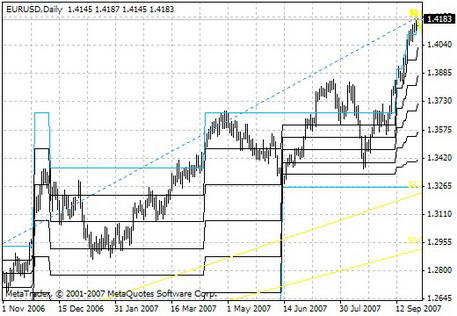
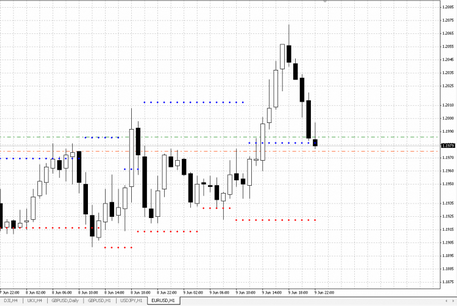
On the graph above, you can see how the price gets down a bit, just to get supported by the top channel. It is a classic example of a channel breakdown, where the price keeps moving with a channel until the new uptrend will be formed.
Trading strategy using channels
The channel breakdown should be considered the most profitable. This tactic is much more likely will lead to a successful transaction than the trading within the channel.
There's a typical trading routine for the channel indicator:
- Configure the channel that connects the maximum/minimum/maximum, or the minimum/maximum/minimum;
- Wait for the moment when the price breaks the channel, and then enter it again;
- Set the stops on the lower level of the channel, with the entrance to the channel breakout;
- Set a point for the support and resistance levels formed in the channel.
The graph below shows how the price breaks through the channel:

- The channel is formed by the minimum and maximum points;
- After an unsuccessful price break through the upper channel border, it rushed down and broke through the lower border;
- The break level shows the past support/resistance level, which means that the scenario is likely to repeat in this area;
- The price repeats the breakthrough at the same level, and then it drops to a certain level of support.
Within such a trading type, the stops can be placed in the intermediate sections of the price fluctuation, up to the break level.
Results
Channel indicators are a part of the standard MT4 tool set, and many traders prefer this type of tool due to its convenience, and, in fact, use it as an already-made trading strategy.
However, just like any other technical tool, this type of indicator shouldn't be used alone. It is necessary to select an additional indicator to work in pair. For example, you can save yourself from wrong decisions using a channel indicator in a pair with the stochastic one. When the price breaks the channel border, you can look at the stochastic indications. If the signal is correct, the stochastic will display this as an overbought state, in the form of crossing lines.
It should also be noted that the successful use of such an indicator will require a practice, so it's better to get used to this tool first before you start working.

 English
 русский


