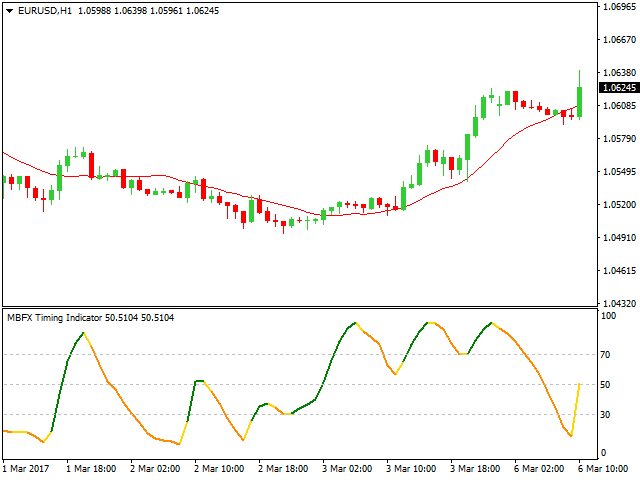
Histogram
The Histogram is a Forex trading indicator, which displays the price dynamics in the form of a candle chart, as well as in the shape of a color histogram. In fact, the Histogram is a complete trading strategy, which is unique since it allows you to make the transactions depending on the single indicator data.
The experienced Forex traders tested this system, and then provided excellent results. Since the trading system is based on the data of a single indicator, it's quite simple to use, which will be a significant advantage for the beginners.
This tool appeared in 2009 and was a part of another trading strategy. Over time, a lot of currency market participants began to apply it, and they consider it relevant even now. At first glance, it may seem that the trade based on the single indicator is an impossible thing. It is understood since no indicator is protected from giving the false signals. Therefore, all the experienced traders use at least two indicators to check each signal for buying or selling, to protect themselves from the losses.
Such a strategy is distinguished by the fact that the Histogram indicator is set on the price chart several times. In this case, the trader is able to monitor the market situation on short, long and medium time intervals. For example, if there is a growing trend on the H4 time frame, then you can focus on opening the purchases on the M15 time frame, ignoring the sale deals. Transactions are opened when the indications of several histograms coincide. Thus, there is no need to use the additional indicators, since the same indicator rechecks its own data.
Features of the Histogram indicator
The practice shows that the system demonstrates the best results on the M15 time interval. In this case, the system can provide one or two transactions for one currency pair per day. It's possible to use this tool on the other timeframes, but this will require the precise adjustment of the indicator parameters. It's also worth noting that there are no guarantees on the financial market, and even the strongest signals can lead to losses sometimes. Don't make the conclusions about the indicator after just the several transactions are made. Only after a few months, it becomes possible to formulate an objective assessment of the indicator in work. This system works best during the trend.
Signals of the indicator
The Histogram indicator displays the colors of red and blue. The red color is for the uptrend; the blue one is for the downtrend. We will consider several examples of the Histogram indications below on the example of the USD/EUR pair.

On the figure above, the indicator displays a good signal to open the purchase transaction. All the histograms are colored blue, and the candlestick chart shows an uptrend the same time, which confirms an opportunity to buy.

This figure shows an example of the favorable sale conditions. It is indicated by the red areas of the indicator. At the moment, the price indicator also shows a downtrend.
When the market is in the flat stage, the Histogram indicator will regularly change its readings, which can lead to losses. It should be noted by the trader using such an instrument, to start trading only when there is a strong market trend.
Summary
Newcomers can get confused starting trading on the foreign exchange market. A lot of tools available allows you to apply different strategies, which makes it hard to choose the most convenient and appropriate strategy, as well as to find the important indicators.
However, one of the main difficulties in currency trading is the fact that the indications of the single tool can never be accepted by the trader as the final signal for a deal. Any experienced trader knows that it's necessary to select at least one additional indicator, which will help to track the false signals.
The Histogram indicator is an exception to such a rule since it's a complete trading system, simple and profitable even for the beginners. The instrument is straightforward to interpret, and the need for the additional indicators is only solved by adding the same Histogram indicator to the chart several times so that the indicator checks its values itself.
However, it's worth noting that such a successful and straightforward scheme only works under conditions of a strong trend. Therefore it's recommended to test this tool on demo accounts before the real trade starts.

 English
 русский


