Exponential Moving Average (EMA)
Exponential moving average (EMA) is a technical analysis indicator that reduces the number of false alarms generated by the system. The indicator considers the most recent prices in the market giving them an advantage compared to the prices before. The importance given to the final price varies depending on the period of work with a moving average. For example, the 10-period moving average will give 18.18% to the last price and 20-period will give only 9.25%.
When trading in the financial market, Forex traders often use indicators that work with moving averages. They smooth out the market prices, which is very important. One of the standard tools is Exponential Moving Average. To test this indicator, download it for free on the MTDownloads website.
How to Calculate EMA?
It is determined by:
- calculation of indicators along with interest rates;
- calculation based on data about periods.
The earliest prices of the asset correspond to the smaller values, the last prices, on the contrary, correspond to the large values. Here is the formula:
EMA [k, n] = EMA [k-1, n] + (2/(n+1)) * (P-EMA [k-1, n]).
It is possible to change the period in 2 ways: by altering the number of k-coefficient or the period.
Let's compare exponential moving average to a simple moving average and understand the principle of the calculations. You work with USD/CHF pair, and its rate fell on the 2nd day of your trading.
The price moves the following way:
- trading day = 0.8720;
- day = 0.8633;
- day = 0.8764;
- day = 0.8849;
- day = 0.8913.
Calculating by these numbers a mere moving average, we will see the final result: (0.8720+0.8633+0.8764+0.8849+0.8913)/5 = 0.8776
When comparing prices on different days, you may notice that it dropped significantly only one time, but the moving average significantly changed. Trading with these results would be quite risky. Thus, calculating by a more complicated formula gives better results.
Application of the Indicator
When trading with exponential moving average, you should pay attention to the asset you plan to work with although the tool can be used with most trading strategies.
One of the trading methods based on this instrument is "EMA Bands" developed by Frank Tenerife. This method of trading is based entirely on work with moving averages without using any other types of indicators. The specified technique helps with any currency pair. The period from 1M to 1D is usually appropriate (M5-M15 is the preferred time). The strategy is based on scalping.
For example, you have set the next lines:
- 3 ЕМА, 5 ЕМА, 7 ЕМА, 9 ЕМА, 11 ЕМА, 13 ЕМА – yellow;
- 21 ЕМА, 24 ЕМА, 27 ЕМА, 30 ЕМА, 33 ЕМА, 36 ЕМА – green;
- 55 ЕМА – red.
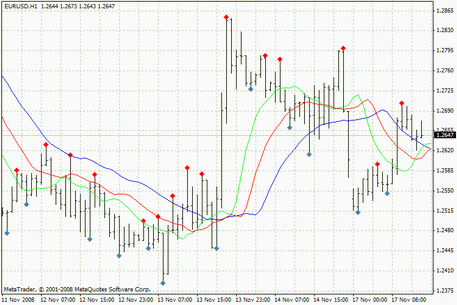
You can enter the market at the moment when the yellow line crosses the red from the bottom upwards. To open a sell position, wait for the time when the yellow lines reverse and start moving downwards to the red one. You can take profits and exit the market when the yellow and green lines intersect, or green lines touch the yellow one.
Pros and Cons
The advantage of this indicator is the faster response to price changes in Forex compared to other types of indicators. So you can get the correct information about the current state of the market.
Also, the program gives an idea about more exact price change, for example, if compared to a simple moving average. Technical analysis of this trading robot gives a trader the opportunity to focus on past prices, which is very important. After all, when trading in the financial market, the most important is an exact situation in Forex at the current moment, not a week or two ago.
Calculating EMA is more complicated compared to other types of indicators. Another disadvantage of this technique is too powerful respond to rapid changes in market prices. So all traders have to use the indicator in the short-term. However, some traders work with this tool in the long-term span identifying price changes and movement of the trend.
Features of EMA
While a standard moving average can respond to price changes only one time during the change of the trend direction, the line of EMA indicator is a smoother option. For this reason, EMA is the most reliable tool of technical analysis in the market.
Try Exponential Moving Average and test its high efficiency. To download the program for free, visit the MTD website.

 English
 русский


