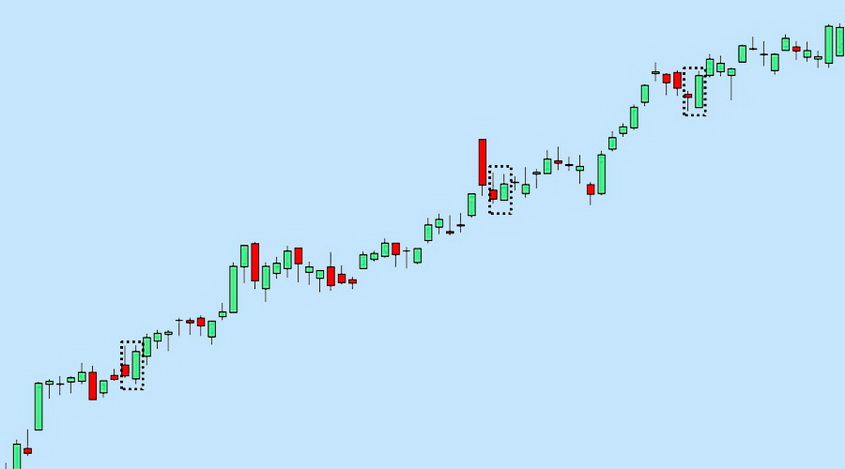
Engulfing Pattern - Application in Trade
Tuesday, 8 August 2017 09:19
Engulfing is one of the most significant patterns of the candlestick analysis. It’s used in the Forex trading. This model means that the trend will change soon. Depending on the type of a trend, there are bullish and bearish engulfing types:

On the graph, this pattern looks like an appearance of a candle, with the body bigger than the previous one. The range of the last bar is completely overlapped by the new one.
Considering such a pattern on the chart, the size of the candle bodies is the most important. If the new bar is much bigger than the previous one, it means a stronger signal. The signal is also considered more powerful if there are more than one candles engulfed.
Opening the Positions
If you see a bullish engulfing on the graph of the asset price, this is a signal to open a purchase order. It’s worth waiting until the bar closes. The Stop Loss order is placed a few points down from the minimal cost. Also, many experienced traders recommend using a trailing stop.
This method is most effective on the daily timeframes.
Selling deals are opened the same way. When a bearish engulfing pattern appears on the chart, the trader waits for the candle to close and opens the position. The Stop Loss is set several points higher than the maximum price, and a trailing stop is also used.
It should be noted that the reversal of the trend is not always accompanied by the engulfing figure. Often one can observe how a candle of a new color overlaps the previous one not entirely, but partially. Such models are called dark cloud covers, and piercing lines.
Dark Cloud Cover
This figure appears at the end of the bullish trend. It looks like a black candle that partially covers white. First, a large bullish candle is drawn, then the price level moves up, and then it goes down. A bearish bar appears, after which the trend becomes descending.

In this situation, you should pay special attention to the size of the bear candle. This signal is stronger, if the new bar overlaps the previous one by more than half.
Piercing Line
This model means a change in the direction of the trend. The downtrend is replaced by an upward trend. It is opposite to a bearish cover, and says that the bulls have gained an advantage, so now they will push the price up.

In this case, it’s especially recommended to pay attention to the size of the new bar. It should cover a bearish candle by more than a half.
Remember that the size of the bar determines the strength of such signals. These patterns should also be considered more significant, if they appear near the levels of resistance and support.
In case of the dark cloud cover and the piercing line appearing, the transactions are open the same way as during the bearish or bullish engulfing.
To trade on the candlestick analysis, you need to know a large number of combinations, each of which forecasts an event on the market. Many traders use Japanese candlesticks as an addition to other trading strategies. This type of analysis can be useful checking the breakdown of the support/resistance levels, as well as in any other situations when the trader is not sure about the indications.
Share
Related articles
- Previous article: Trend Reversal Patterns – Features of the Application
- Next article: Monitoring the Long Time Frames with the Mcandle Indicator

 English
 русский


