22.03.2018
Futures trading for beginners

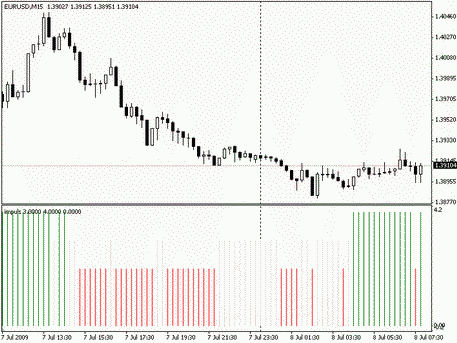
The indicator shows areas that are not recommended to use for entering the market to buy/sell. On the chart, it looks like a histogram consisting of lines of different colors: red lines denote an area where it is not recommended to buy, the green area reflects prohibition to sell. The gray zone is neutral.
Indications of the indicator are calculated on the basis of CC and MACD. If the values of both tools grow, the bar of the histogram will get a green color. If the values fall, it will be red.
This indicator shows trends at the very beginning of their formation. However, it is only used in combination with other indicators that can filter its signals.
Share