22.03.2018
Futures trading for beginners

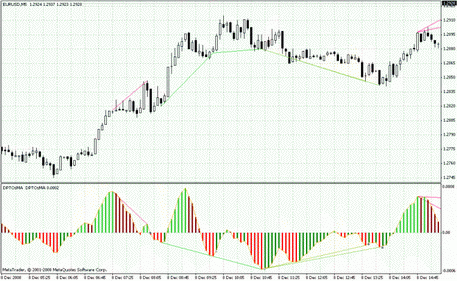
The indicator is used along with OsMA Divergence v1. To do it, open ind_OsMAColored_v1 and drag it to the OsMA Divergence v1 window that appears. The indicator's chart will become a colored histogram. Its significant points are connected by lines of different colors. The gray points show divergences. The indicator works best on a 5-minute chart.
Share