22.03.2018
Futures trading for beginners

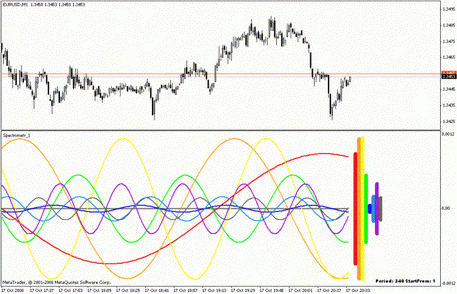
The indicator refers to group of tools for the calculating volatility. It reflects the range of fluctuations in the price of a financial asset. On the right side of a chart the amplitudes of the vibration spectrum are presented, in the form of colored bands. The closer the diagram approaches the zero line, the smaller the amplitude of price fluctuations.
Share