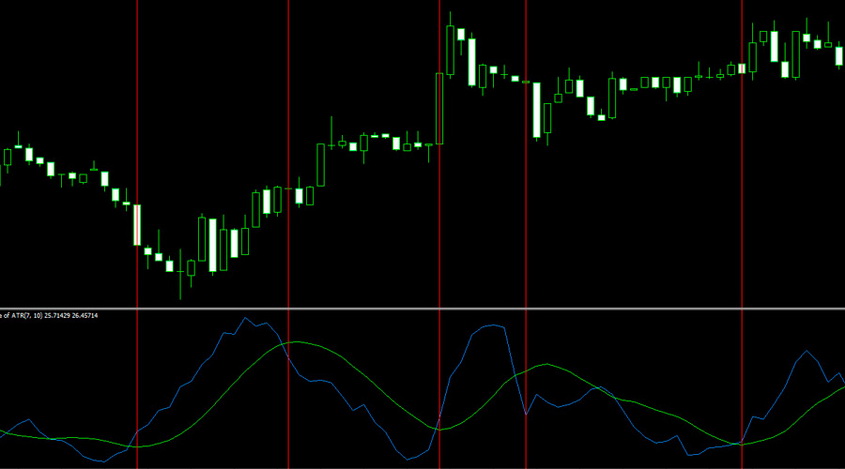
Features of Basement Indicators
Tuesday, 25 July 2017 01:33
There are a lot of trading indicators for the Forex market. They differ not only in the type of data displayed, but also in the algorithms used, and even in the way they are shown.
Some tools show their data directly in the chart window, which can cause particular difficulties with the perception of their readings. Tools of the other type display information in a separate window, below the graph. This type is also called the basement indicators. The advantages of such instruments include the fact that they don’t overlap the price chart, and facilitate the analysis of data.
Basement indicators can output data as a curve (for example, MACD) or a histogram. As an example, we will consider some of them in more detail.
MACD Basement Oscillator

MACD stands for Moving Average Convergence Divergence. This tool shows the divergence of three moving averages, one of which is drawn as a histogram. The difference between the other two is shown as a red line.
MACD has commonly used trading pairs with high volatility during the periods of significant activity. It identifies the right points for opening the positions.
The Stochastic Basement Indicator

Stochastic also has a separate window located below the chart of the asset value. Readings are formed from two lines - the signal line and the main one.
It also displays two dotted lines that indicate the overbought and oversold areas. When two lines intersect, the instrument gives a signal to enter the market.
TTL indicator

TTL is a tool that displays data as a histogram.
A distinctive feature of TTL is the fact that its data isn’t redrawn. It can serve as an excellent addition to a huge variety of trading strategies. Many traders recommend using it as part of tactics that use the Stochastic as the primary tool. In this case, TTL will help to filter out the false signals.
TTL is incredibly easy to use. The green color of the histogram indicates a bullish trend, and the red color indicates a bearish trend. The length of the plot shows the strength of the trend. If the trend turns, the color of the histogram also changes in the opposite direction.
If you use such an indicator for the first time, it’s better to use the standard settings. By default, the signal levels are set as 30 and 70. If the asset price rises above the level of 70, this indicates the overbought state. If the value falls below 30, then the asset is oversold.
The instrument provides the following signals to enter the market:
- If the readings fall below the central level, and there is a red histogram, this means a signal to open the sale;
- If the readings rise above the fundamental level, and there is a green histogram, this means a signal for the purchase.
It’s worth noting that the signals of such an indicator slightly lag behind. Don’t use it for too short periods to avoid the false indications.
There are a lot of other basement indicators. Many of them can be utilized simultaneously. However, don’t use too many different tools on the same chart. Their algorithms can work on the same principle, and it will be impossible to interpret the signals correctly.
Share
Related articles
- Previous article: Monitoring the Long Time Frames with the Mcandle Indicator
- Next article: The reversal in Forex – Methods of its Determination

 English
 русский


