22.03.2018
Futures trading for beginners

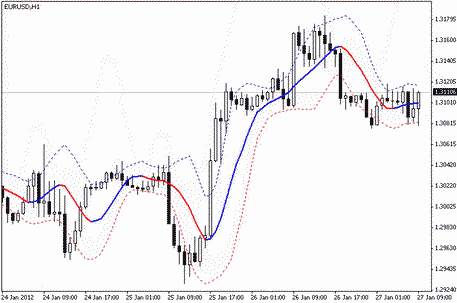
The indicator resembles the Rj_RMA and Bollinger bands instruments and is calculated from the High/Low price. It is used as support and resistance lines and helps visually determine the best place for a buy/sell order depending on the market movement.
As soon as a trend change begins, you need to place pending orders on the extreme border or on the middle line of the indicator. The smaller the selected timeframe, the greater is the number of calculations of the indicator. For example, you can set the value of 5 on the M30 and so on.
Share