Murrey Levels - Application of the Murrey Levels Indicator
Tuesday, 25 July 2017 00:58
Murrey levels is a popular tool for the Forex market analysis. It’s based on the Gann's theory, and uses the 8x8 Gann square. This tool isn’t easy to use, but with proper application it can provide a good profit in trading.
Many traders consider the remoteness of the Gann square from the market as its main drawback. To perform the accurate calculations, the edges of the square should be correctly positioned relative to the beginning of the trend and its end. The accuracy of the coordinates directly determines the profitability of such a method.
It should be noted that the Murrey’s system is best suited for markets with a cyclical structure, with the intervals equal to a quarter, or one year. This tool also can be used on different markets, and on timeframes of any duration.
Features of the Indicator
The indicator draws eight basic levels, and four additional ones on the asset price chart. Thus, the graph is divided into several zones, which facilitates the compilation of the price dynamics forecast.

According to the description of T. Henning Murray himself, these marks are used as follows.
- 0/8 and 8/8 are the most significant lines. Approaching them, the cost of the asset will turn with the greatest probability. Breaking these lines, as a rule, the price forms deep corrections.
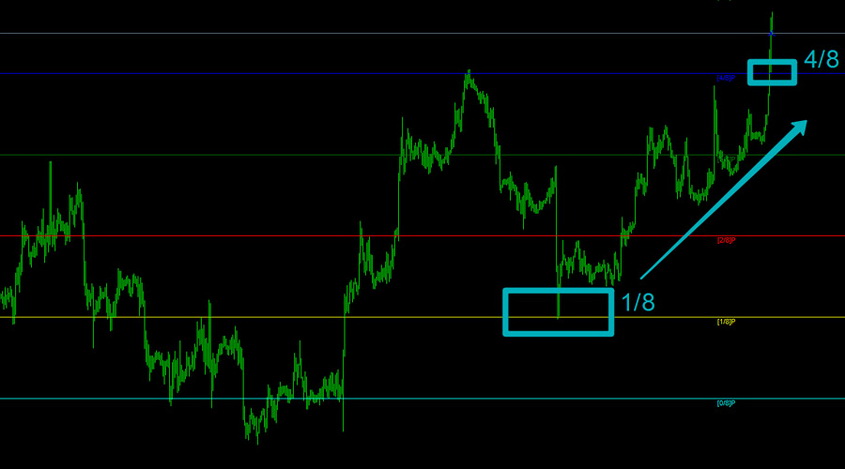
- 1/8 and 8/8 are the lines that are easily broken by the price. If the value of the asset stays near such marks, the probability of a trend to change increases. In this case, the next goal will be the 4/8 mark. As a rule, it’s possible to determine the future turn even when the price tests the level. Thanks to that, the trader is able to react quickly to changes of the market situation, and so open a winning deal.
- 2/8 and 6/8 are the second most important marks. The trend turns here with high probability. If you see the price passing one of these lines, but starting the correction, then be prepared for a possible trend reversal, or a long-term resistance. For a price moving from the overbought or the oversold zone, the Take Profit orders are often set at these areas.
- 3/8 and 5/8. These two lines often form a channel for the price when the market is in the flat stage. Passing through these levels, the graph often shows the fluctuations. If the price leaves this channel after a long side trend, one should expect the further development in the same direction as the broken border.
- 4/8 - the central line, which is often used to open the positions. The work is carried out according to the following scheme: if the asset value moves from 0/8, and breaks through 4/8, then it’s the right time to open a buy order. If the price breaks through this level, moving from the 8/8 line, then it’s a good opportunity to open a sale.
As mentioned above, the 0/8 and 8/8 marks are the strong resistance levels. However, they can be broken through with a strong trend movement. For such a reason, the additional levels have been added to the grid.
- -1/8 and +1/8 - you can often see how the price rebounds from these levels, after a breakthrough the 0/8 and 8/8 levels.
- -2/8 and +2/8 - as a rule, they don’t serve as an obstacle to the price. Sometimes there are the minor corrections of the price.
Application in Trading
Mostly, the trade is made on the breakdown of the central 4/8 line, and with a rebound from 0/8 and 8/8. These signals should be considered the strongest ones, and the most experienced traders choose such signals to open the deals.
These lines are also used for the Take Profit and Stop Loss orders. Obviously, a particular level cannot be triggered with a probability of 100%, but they, in any case, serve as a prompt for the suitable points for such orders.
Suppose the price reaches the level of 4/8, moving from 0/8. In this situation, it’s logical to open the purchase deal, placing a Take Profit order slightly below the 8/8 line. Accordingly, the Stop Loss must be set several points lower the 0/8 mark.
Taking these decisions, the trader assumes that the probability of rebound from the 0/8 and 8/8 lines is much higher than the probability of a breakdown.
Don’t forget that the trading with several tools is the most profitable. It’s almost impossible to predict the movement of the value with the absolute probability. Murrey levels are easily combined with other trading strategies, significantly increasing their profitability, and reducing the risks.
Share
Related articles
- Previous article: The Best Technical Indicators on the Forex Market
- Next article: Levels of Support and Resistance

 English
 русский


